OriginLab Corporation - Data Analysis and Graphing Software - 2D graphs, 3D graphs, Contour Plots, Statistical Charts, Data Exploration, Statistics, Curve Fitting, Signal Processing, and Peak Analysis      
Show: Sort By:

Spiral Bar Chart - by Period
Read more...    More of same type...        More by same keywords...
Row-wise Line Series with Error Bars
Read more...    More of same type...        More by same keywords...
Ternary Phase Diagram
Read more...    More of same type...        More by same keywords...
Heatmap of CO2 Emissions
Read more...    More of same type...        More by same keywords...
XY error bar plot showing uniformity of laminar nozzle velocity.
Read more...    More of same type...        More by same keywords...
Scatter Plot with Color and Size Mapping for Acoustic Emission Detection
Read more...    More of same type...        More by same keywords...
Chord Diagram for Mobile Phone Brand Switching Behavior
Read more...    More of same type...        More by same keywords...
Double Y Violin Plot
Read more...    More of same type...        More by same keywords...
Line plot with inset graph depicting the anisotropic decay of 1,6-Diphenyl-1,3,5-hexatriene in toluene (25 mg/ 25 ml) at 430 nm.
Read more...    More of same type...        More by same keywords...
Correlation Ellipse Matrix
Read more...    More of same type...        More by same keywords...
Lower Triangle Heatmap
Read more...    More of same type...        More by same keywords...
Graph with Table
Graph with Table
Read more...    More of same type...        More by same keywords...
3D Walls and Lines
3D Walls and Lines
Read more...    More of same type...        More by same keywords...
Grouped Stacked Bar Plot
Read more...    More of same type...        More by same keywords...
Polar contour with custom orientation and contour line
Read more...    More of same type...        More by same keywords...
Grouped Box Chart with Customized Box Style
Read more...    More of same type...        More by same keywords...
This multi-panel graph uses Origin? strong layering capability to represent high-resolution electron energy-loss spectra from a GaN surface.
Read more...    More of same type...        More by same keywords...
Violin with Stick
Violin with Stick
Read more...    More of same type...        More by same keywords...
The distribution of nanohardness of stainless steel cross-section
Read more...    More of same type...        More by same keywords...
Open-High-Low-Close chart
Read more...    More of same type...        More by same keywords...
Anomaly Line Plot
Anomaly Line Plot
Read more...    More of same type...        More by same keywords...
Column Scatter Chart with Mean Line
Read more...    More of same type...        More by same keywords...
Grouped Stacked Lines
Read more...    More of same type...        More by same keywords...
Box Plot with Mean Points Connected
Read more...    More of same type...        More by same keywords...
Variability Plot
Variability Plot
Read more...    More of same type...        More by same keywords...
Connecting 3D Points with a Spline
Read more...    More of same type...        More by same keywords...
Credit Spread Slopes Plot with Timeline
Read more...    More of same type...        More by same keywords...
3D Trajectory with Projection
Read more...    More of same type...        More by same keywords...
Wind Vector Stick
Wind Vector Stick
Read more...    More of same type...        More by same keywords...
Fibonacci sequences
Fibonacci sequences
Read more...    More of same type...        More by same keywords...
3D Stacked Line&Symbol
Read more...    More of same type...        More by same keywords...
Trellis Scatter with Mean Overlay
Read more...    More of same type...        More by same keywords...
Bar Chart with Customized Table Below X Axis
Read more...    More of same type...        More by same keywords...
Unbalanced Grouped Box Plot
Read more...    More of same type...        More by same keywords...
The motivation for determining the distance from fixed stars
Read more...    More of same type...        More by same keywords...
Liquid-liquid Phase Diagram
Read more...    More of same type...        More by same keywords...
Demagnetization Curves Custom Report of Sintered Nd-Fe-B Magnets
Read more...    More of same type...        More by same keywords...
2D Integration Plot
2D Integration Plot
Read more...    More of same type...        More by same keywords...
Double-Y line graph of a bubble resonance signal.
Read more...    More of same type...        More by same keywords...
2D Graph with Multiple Origin Features
Read more...    More of same type...        More by same keywords...
Projected density of states (PDOS) for the H- ion located at fixed distances in front of a Na/Cu(111) surface
Read more...    More of same type...        More by same keywords...
Multi-layer Contour Plot of Probability Distribution of Persistence Strength
Read more...    More of same type...        More by same keywords...
Ohio Covid-19 Status
Read more...    More of same type...        More by same keywords...
This graph portrays flood impact on the morphology of channels abandoned by rivers.  
It uses a Contour Color Fill plot to depict depth elevation and a Vector XYAM plot to show flow velocities.
This graph portrays flood impact on the morphology of channels abandoned by rivers. It uses a Contour Color Fill plot to depict depth elevation and a Vector XYAM plot to show flow velocities.
Read more...    More of same type...        More by same keywords...
Heatmap of CO2 Emissions
Read more...    More of same type...        More by same keywords...
3D Surface Map from DEM
Read more...    More of same type...        More by same keywords...
Stacked Lines by Given Values
Read more...    More of same type...        More by same keywords...
Floating bar chart generated from two data sets containing minimum and maximum concentration values
Read more...    More of same type...        More by same keywords...
Grouped box chart with color indexed datapoint
Read more...    More of same type...        More by same keywords...
3D Stacked Bars
3D Stacked Bars
Read more...    More of same type...        More by same keywords...
Chipped Doughnut Plot
Read more...    More of same type...        More by same keywords...
Fill Areas with Geology Patterns
Read more...    More of same type...        More by same keywords...
Waterfall with Multiple Curves at Same Z Location
Read more...    More of same type...        More by same keywords...
Normalized Bullet Chart
Read more...    More of same type...        More by same keywords...
Spiral Bar Chart - by Windings
Read more...    More of same type...        More by same keywords...
Marginal histogram with Rug
Read more...    More of same type...        More by same keywords...
Sankey Diagram of U.S. 2018 Energy Consumption
Read more...    More of same type...        More by same keywords...
3D Scatter with Colormap, scatter size proportional to another column (Engine Displacement)
Read more...    More of same type...        More by same keywords...
Zooming into a Section of a Ternary Plot by Setting Axis Scales
Read more...    More of same type...        More by same keywords...
Fill area between curves, both above and below
Read more...    More of same type...        More by same keywords...
Wind Speed in Northern Hemisphere
Read more...    More of same type...        More by same keywords...
Individual Before-after Lines
Read more...    More of same type...        More by same keywords...
Symmetric Error Bars
Read more...    More of same type...        More by same keywords...
Multi-Panel Graphs Plotted by Grouped Data
Read more...    More of same type...        More by same keywords...
Baseline-subtracted UV-Vis spectrum of the linear conjugated dye 1,1
Baseline-subtracted UV-Vis spectrum of the linear conjugated dye 1,1''-Diethyl-2,2''-carbocyanine chloride (pinacyanol chloride). Peaks are fitted with the Gaussian fitting function.
Read more...    More of same type...        More by same keywords...
Windrose Plot with Open Center
Read more...    More of same type...        More by same keywords...
Tile Grid Map for Periodic Table
Read more...    More of same type...        More by same keywords...
Waterfall for Raman Peak Fitting
Read more...    More of same type...        More by same keywords...
Double Y Half Box Plot
Read more...    More of same type...        More by same keywords...
Colormap surface and color contour graphs profiling differences in body heat transfer.
Read more...    More of same type...        More by same keywords...
Temperature over Time
Read more...    More of same type...        More by same keywords...
Sankey Diagram of Contribution During 2018 Election Cycle
Read more...    More of same type...        More by same keywords...
Tetrahedral Plot
Tetrahedral Plot
Read more...    More of same type...        More by same keywords...
Two polar contour plots overlaid with one polar chart.
Read more...    More of same type...        More by same keywords...
Light Propagation Through a Bulk-fill Composite in MOD Restorations
Read more...    More of same type...        More by same keywords...
LULC Change in Different Periods
Read more...    More of same type...        More by same keywords...
Half-triangle Scatter Matrix
Read more...    More of same type...        More by same keywords...
Spectroscopy data series based on frequency (specified by column long name), each plot is Amplitude vs Time.
Read more...    More of same type...        More by same keywords...
Nonlinear Curve Fitting in Supramolecular Chemistry Analysis
Read more...    More of same type...        More by same keywords...
Spherical Contour Plot
Read more...    More of same type...        More by same keywords...
Fill Area Above and Below Curve
Read more...    More of same type...        More by same keywords...
Individual contour plots on left side ovelayed with transparency on right side.
Read more...    More of same type...        More by same keywords...
Bridge Chart with Multiple Total Columns
Read more...    More of same type...        More by same keywords...
Hierarchical Edge Bundling for Trade of Hierarchical Edge Bundling for Trade of Football Players
Read more...    More of same type...        More by same keywords...
Map Combining Line and Contour Plots
Read more...    More of same type...        More by same keywords...
Statistics Bars & Line Series
Read more...    More of same type...        More by same keywords...
Stacked Radial Bar Plot
Read more...    More of same type...        More by same keywords...
Chord Diagram in Ratio Layout
Read more...    More of same type...        More by same keywords...
Grouped notched box chart
Read more...    More of same type...        More by same keywords...
Temperature as secondary X axis in Arrhenius Plot
Read more...    More of same type...        More by same keywords...
ROC Curve (Pro)
ROC Curve (Pro)
Read more...    More of same type...        More by same keywords...
Schoeller Diagram
Schoeller Diagram
Read more...    More of same type...        More by same keywords...
3D ternary surface with projection
Read more...    More of same type...        More by same keywords...
Network Plot of Trade of Football Players
Read more...    More of same type...        More by same keywords...
3D Pie Chart of a Population Study
Read more...    More of same type...        More by same keywords...
Crime rate comparison all over the United States with a bubble scale
Read more...    More of same type...        More by same keywords...
Ternary contour plot from worksheet with three data columns represented as ternary coordinates, and one column used to compute the contour.
Read more...    More of same type...        More by same keywords...
Alluvial Diagram of Montana Economic Outlook Poll
Read more...    More of same type...        More by same keywords...
Single-walled nanotube emission intensity plotted as a color-coded contour plot.
Read more...    More of same type...        More by same keywords...
100% Stacked Column Plot with Line&Symbol Overlay
Read more...    More of same type...        More by same keywords...
Tile Grid Map for US Crime Rate
Read more...    More of same type...        More by same keywords...
Cancer Incidence in USA
Read more...    More of same type...        More by same keywords...
Sankey Diagram of Water and Energy Flows in Production
Read more...    More of same type...        More by same keywords...
3D Bars Side by Side
Read more...    More of same type...        More by same keywords...
Polar Bar with Variable Column Width
Read more...    More of same type...        More by same keywords...
Overlap Panels with Multiple Categories Combination
Read more...    More of same type...        More by same keywords...
3D multiple colormap surface with transparent plane.
Read more...    More of same type...        More by same keywords...
Trellis Column Plot with Error Bar
Read more...    More of same type...        More by same keywords...
Image Graph with multiple horizontal and vertical profiles/projections.
Read more...    More of same type...        More by same keywords...
Create Cylinder Colored by a Different Data Source
Read more...    More of same type...        More by same keywords...
Compass Plot of Wind Speed
Read more...    More of same type...        More by same keywords...
Sunburst Plot with Different Radius
Read more...    More of same type...        More by same keywords...
YBCO superconductor growth study using multiple sets of axes and one offset to display deposition pressure, annealing pressure, and the change in critical temperature over time.
Read more...    More of same type...        More by same keywords...
Anomaly Plot of Iceland Temperature
Read more...    More of same type...        More by same keywords...
3D Histograms with Distribution Fit
Read more...    More of same type...        More by same keywords...
Python - t-SNE Dimensionality Reduction
Read more...    More of same type...        More by same keywords...
Grouped Floating Column Plot
Read more...    More of same type...        More by same keywords...
Scatter plot depicting the isotope signature of N sources found in IAB iron meteorites.
Read more...    More of same type...        More by same keywords...
Calculated resonant X-ray scattering intensity from nickel oxide
Read more...    More of same type...        More by same keywords...
Land Surface Temperature
Read more...    More of same type...        More by same keywords...
Evenly Spaced Column Plot with Numeric X
Read more...    More of same type...        More by same keywords...
2D Kernel Density Plot
Read more...    More of same type...        More by same keywords...
XYZZ Heatmap with Diagonally Split Cells
Read more...    More of same type...        More by same keywords...
The Zoom Graph plot template includes a moveable rectangle which can be used to enlarge a region of interest.
Read more...    More of same type...        More by same keywords...
Cluster Column Plot
Cluster Column Plot
Read more...    More of same type...        More by same keywords...
Half Violin Plot
Half Violin Plot
Read more...    More of same type...        More by same keywords...
Smart labeling attached to Y2 with vertical poly-leader-line
Read more...    More of same type...        More by same keywords...
Trellis Plot with Double Y Axes
Read more...    More of same type...        More by same keywords...
Colormapped Line Series
Read more...    More of same type...        More by same keywords...
Display Date and Time Tick Labels in Multiple Lines
Read more...    More of same type...        More by same keywords...
Contour plot depicting vertical wind velocities as a function of time and height, overlaid with a vector plot depicting wind speed and direction.
Read more...    More of same type...        More by same keywords...
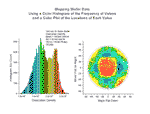
These two graphs display data from a study of dislocation densities on disk-shaped semiconductor wafers.  The first graph is a histogram generated from data stored in multiple worksheets.  The second graph is a scatter plot of the location of a measured value on the wafer.
These two graphs display data from a study of dislocation densities on disk-shaped semiconductor wafers. The first graph is a histogram generated from data stored in multiple worksheets. The second graph is a scatter plot of the location of a measured value on the wafer.
Read more...    More of same type...        More by same keywords...
3D XYY Bars with Connect Lines
Read more...    More of same type...        More by same keywords...
TimeLine for Financial Crisis
Read more...    More of same type...        More by same keywords...
Multi-panel graph with multiple linked axes for visualizing complex data.
Read more...    More of same type...        More by same keywords...
2D XYXY vector plot displaying  Arnold
2D XYXY vector plot displaying Arnold''s cat mapping transformation
Read more...    More of same type...        More by same keywords...
Color-filled contour plot with color scale representing matrix data, overlaid with white contour lines representing fit matrix.
Read more...    More of same type...        More by same keywords...
Scatter Matrix Plot with Histogram in Diagonal Cells
Read more...    More of same type...        More by same keywords...
3D Waterfall with additional plane
Read more...    More of same type...        More by same keywords...
Heatmap in Bars
Heatmap in Bars
Read more...    More of same type...        More by same keywords...
3D Vector plot with Lighting
Read more...    More of same type...        More by same keywords...
Stacked Heatmap
Stacked Heatmap
Read more...    More of same type...        More by same keywords...
Rotational-vibrational transitions for first 5 R and P branches for isotopologues of HCl
Read more...    More of same type...        More by same keywords...
Gradient Filled 3D Colormap Bar
Read more...    More of same type...        More by same keywords...
Flatten Waterfall Plot
Read more...    More of same type...        More by same keywords...
Reconstructed Emissivity Map
Read more...    More of same type...        More by same keywords...
Double Z 3D XYZ Stacked Bars
Read more...    More of same type...        More by same keywords...
High-low-close plot displaying high, low, and close prices of the NASDAQ 100 stocks over a four-month period.
Read more...    More of same type...        More by same keywords...
Controlling Line Style
Read more...    More of same type...        More by same keywords...
Three datasets plotted as lines with error bars and semi-transparent fill areas.
Read more...    More of same type...        More by same keywords...
3D surface to displays a 3D Sphere drawn with parametric equations.
Read more...    More of same type...        More by same keywords...
Making Dynamic Inset Graphs
Read more...    More of same type...        More by same keywords...
Bubble Plot on Google Map
Read more...    More of same type...        More by same keywords...
Sunburst Plot for Browser Market Share
Read more...    More of same type...        More by same keywords...
Wind speed and direction over time represented in a windrose diagram.
Read more...    More of same type...        More by same keywords...
3D Pie Chart - Explode with Next
Read more...    More of same type...        More by same keywords...
Stacked column plot with variable column width
Read more...    More of same type...        More by same keywords...
XYZ contour plot of 30-year mean temperature for the month of January
Read more...    More of same type...        More by same keywords...
Plot Row-wise Data as Line Series in Origin 2017
Read more...    More of same type...        More by same keywords...
3D Bars on a Map
3D Bars on a Map
Read more...    More of same type...        More by same keywords...
XYY 3D 100% Stacked Bars
Read more...    More of same type...        More by same keywords...
Correlation Network Plot
Read more...    More of same type...        More by same keywords...
Stiff Diagram Maps
Stiff Diagram Maps
Read more...    More of same type...        More by same keywords...
Iron Size Partitioning
Read more...    More of same type...        More by same keywords...
Annotations on Graph
Read more...    More of same type...        More by same keywords...
X-ray Diffraction (XRD) Stack Plots
Read more...    More of same type...        More by same keywords...
Lower Triangular Scatter Matrix
Read more...    More of same type...        More by same keywords...
3D Surface Plot from Virtual Matrix with a contour plot projected onto xy plane
Read more...    More of same type...        More by same keywords...
Make Stacked Graph with Same Axis Unit Length
Read more...    More of same type...        More by same keywords...
Double-Y Waterfall
Double-Y Waterfall
Read more...    More of same type...        More by same keywords...
Bar Map for Crime in US
Read more...    More of same type...        More by same keywords...
Sunburst Color by Level
Read more...    More of same type...        More by same keywords...
Fill area plot with vector overlay
Read more...    More of same type...        More by same keywords...
Polar chart with log scale
Read more...    More of same type...        More by same keywords...
3D 100% Stacked Walls
Read more...    More of same type...        More by same keywords...
Contour Plot from Categorical Z Values
Read more...    More of same type...        More by same keywords...
3D Scatter plot with drop line, showing the population of the United States
Read more...    More of same type...        More by same keywords...
Surface plot with colormap values assigned from another matrix.
Read more...    More of same type...        More by same keywords...
Single Block Bars
Single Block Bars
Read more...    More of same type...        More by same keywords...
Box chart with width by variable
Read more...    More of same type...        More by same keywords...
Import Google Map and Plot Data on it
Read more...    More of same type...        More by same keywords...
Ternary chart with gradient fill for layer background, and color mapping of data points using another dataset.
Read more...    More of same type...        More by same keywords...
Zero length axis break to change scale
Read more...    More of same type...        More by same keywords...
With the new Treemap Plot app, you can now create treemap plot with custom order and coloring in Origin or OriginPro.
Read more...    More of same type...        More by same keywords...
Lollipop Plot for GDP
Read more...    More of same type...        More by same keywords...
Trellis Plots - Box Charts
Read more...    More of same type...        More by same keywords...
Colormap Sunburst Plot for World Happiness Report
Read more...    More of same type...        More by same keywords...
Windrose graph displaying wind speed and wind direction
Read more...    More of same type...        More by same keywords...
Grain imports and consumption in rural and urban
Read more...    More of same type...        More by same keywords...
Polar function plot
Polar function plot
Read more...    More of same type...        More by same keywords...
Grouped Probability Plot
Read more...    More of same type...        More by same keywords...
Chord Diagram for Global Migration
Read more...    More of same type...        More by same keywords...
Grouped Stacked Column Plot with Tick Label Table
Read more...    More of same type...        More by same keywords...
COVID-19 Confirmed Cases in Europe
Read more...    More of same type...        More by same keywords...
Particle analysis study represented in two-panel column/bar graph with inset plots
Read more...    More of same type...        More by same keywords...
Stacked Bars with Negative Log Scale
Read more...    More of same type...        More by same keywords...
Heatmap Plot with Labels
Read more...    More of same type...        More by same keywords...
Waterfall plots from XYYY data with Z scale from custom parameter row.
Read more...    More of same type...        More by same keywords...
Stacked Bar Map
Stacked Bar Map
Read more...    More of same type...        More by same keywords...
Symbol plot with size and color mapped to XY data, and with transparency applied for improved visibility of overlapping data points
Read more...    More of same type...        More by same keywords...
US Receipts by Source 1970-2012
Read more...    More of same type...        More by same keywords...
Particle Size Fractions with Depth
Read more...    More of same type...        More by same keywords...
US Zipcode Density Map
Read more...    More of same type...        More by same keywords...
Plotting Bar/Column Graphs with Indexed Patterns
Read more...    More of same type...        More by same keywords...
3D scatter plot with error bars and 3D surface
Read more...    More of same type...        More by same keywords...
Bar and scatter plot with error bars showing soil contents in Sinkiang province, China.
Read more...    More of same type...        More by same keywords...
Correlation Plot-Correlation Scatters
Read more...    More of same type...        More by same keywords...
Waterfall with Smooth Lines
Read more...    More of same type...        More by same keywords...
Grouped column plot with error bar
Read more...    More of same type...        More by same keywords...
Bubble + Color Mapped Plot depicting earthquake data, both magnitude (bubble) and depth (colormap).
Read more...    More of same type...        More by same keywords...
Weibull Probability Plot
Read more...    More of same type...        More by same keywords...
3D XYZ Floating Bars for Flowering Period
Read more...    More of same type...        More by same keywords...
The radar chart is used primarily for data comparison.
Read more...    More of same type...        More by same keywords...
Electric Field Lines
Read more...    More of same type...        More by same keywords...
3D Stacked Walls with Lighting
Read more...    More of same type...        More by same keywords...
Stacked Radial Plots
Read more...    More of same type...        More by same keywords...
Cropped polar chart with custom orientation and radian scale
Read more...    More of same type...        More by same keywords...
Parallel Set without Combined Sets
Read more...    More of same type...        More by same keywords...
Grouped Violin Plot
Grouped Violin Plot
Read more...    More of same type...        More by same keywords...
Parallel Plot with Common Axis Range
Read more...    More of same type...        More by same keywords...
Alluvial Diagram of Titanic Survive Status
Read more...    More of same type...        More by same keywords...
Phase Diagram of Water
Read more...    More of same type...        More by same keywords...
I-Shaped box chart with overlapped data point
Read more...    More of same type...        More by same keywords...
Grouped line plot with log scale Y axis
Read more...    More of same type...        More by same keywords...
Four graphs with custom annotations depicting mid-range IR spectra of the acid form of zeolite SSZ-35.
Read more...    More of same type...        More by same keywords...
Hierarchical Edge Bundling for Global Wood Trade in 2021
Read more...    More of same type...        More by same keywords...
Multi-panel plot shows experimental x-ray emission (XES) and absorption (XAS) spectra
Read more...    More of same type...        More by same keywords...
Doughnut of Pie
Doughnut of Pie
Read more...    More of same type...        More by same keywords...
Browser COVID19 Confirmed Top 100 Global
Read more...    More of same type...        More by same keywords...
Overlay of two contour plots in one graph layer.
Read more...    More of same type...        More by same keywords...
Double Y-Line Series
Read more...    More of same type...        More by same keywords...
Sankey Map of US Imports and Exports
Read more...    More of same type...        More by same keywords...
QC (X bar R) Chart
QC (X bar R) Chart
Read more...    More of same type...        More by same keywords...
Piper diagram with TDS and point by point legend
Read more...    More of same type...        More by same keywords...
Ternary plot with flexible scale
Read more...    More of same type...        More by same keywords...
Line and symbol graph with inset plot showing the effect of the readout temperature on the optically stimulated luminescence (OSL) signal in BeO ceramics (Thermalox 995).
Read more...    More of same type...        More by same keywords...
3D XYY ribbons displaying potential surface calculations for a 4-Cu-atom chain.
Read more...    More of same type...        More by same keywords...
Bland-Altman Plot
Bland-Altman Plot
Read more...    More of same type...        More by same keywords...
Flow Cytometry Chart
Read more...    More of same type...        More by same keywords...
Box Plot with Histogram
Read more...    More of same type...        More by same keywords...
Projected Band Structure Diagram
Read more...    More of same type...        More by same keywords...
Electrochemical Reaction
Read more...    More of same type...        More by same keywords...
Hierarchical Circular Packing Graph
Read more...    More of same type...        More by same keywords...
Bar Chart with Data Points Overlapped
Read more...    More of same type...        More by same keywords...
Using Bridge Chart to Plot Stacked Column with Positive and Negative Values
Read more...    More of same type...        More by same keywords...
Weather History for Washington, DC in June, 2002 to 2013
Read more...    More of same type...        More by same keywords...
Alluvial Diagram of Popular Kids
Read more...    More of same type...        More by same keywords...
Shading Between Curve
Read more...    More of same type...        More by same keywords...
Corner Difference Histogram
Read more...    More of same type...        More by same keywords...
3Y-YY Column+Line Chart
Read more...    More of same type...        More by same keywords...
The Basics of Creating a Trellis Plot with Origin 2017
Read more...    More of same type...        More by same keywords...
Multi-panel graph woth both 2D and 3D plots
Read more...    More of same type...        More by same keywords...
Polar Graph of Date and Time Data
Read more...    More of same type...        More by same keywords...
Marginal distribution curve
Read more...    More of same type...        More by same keywords...
Doughnut with Different Radius
Read more...    More of same type...        More by same keywords...
Stacked Total Bridge Chart
Read more...    More of same type...        More by same keywords...
Alluvial Plot from Summarized Data
Read more...    More of same type...        More by same keywords...
Double Y Box Chart
Double Y Box Chart
Read more...    More of same type...        More by same keywords...
Kite Diagram for Pigment Concentrations
Read more...    More of same type...        More by same keywords...
Location of Soils
Location of Soils
Read more...    More of same type...        More by same keywords...
Relative Electric Field Density
Read more...    More of same type...        More by same keywords...
3D bar graph with labels
Read more...    More of same type...        More by same keywords...
Human Disease Network
Read more...    More of same type...        More by same keywords...
2D Pie Chart of a Population Study
Read more...    More of same type...        More by same keywords...
Pie with Different Radius
Read more...    More of same type...        More by same keywords...
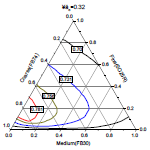
This ternary diagram displays the packing fraction when three particle types are combined.  Each line in the graph represents a constant value for the packing fraction as a function of the fractional contribution of the three particles (course, fine, and medium) in the mixture.
This ternary diagram displays the packing fraction when three particle types are combined. Each line in the graph represents a constant value for the packing fraction as a function of the fractional contribution of the three particles (course, fine, and medium) in the mixture.
Read more...    More of same type...        More by same keywords...
Contour plot illustrating the influence of two different agents on the survival rate of cryopreserved red blood cells.
Read more...    More of same type...        More by same keywords...
3D bar plot on a flatten surface, showing the population distribution of the United States
Read more...    More of same type...        More by same keywords...
3D bar graph of matrix data with transparency,  where the matrix Z values are used for the colormap.
3D bar graph of matrix data with transparency, where the matrix Z values are used for the colormap.
Read more...    More of same type...        More by same keywords...
Network Diagram for Food Habits
Read more...    More of same type...        More by same keywords...
Population Density of Cities in Continental United States
Read more...    More of same type...        More by same keywords...
Energy Splitting of Hydrogen Molecule Caused by Various Physics Interactions
Read more...    More of same type...        More by same keywords...
Horizontal Alluvial Plot
Read more...    More of same type...        More by same keywords...
Grouped column plot with asterisk bracket to show significant difference
Read more...    More of same type...        More by same keywords...
Unicode Symbol Scatter
Read more...    More of same type...        More by same keywords...
Correlation Plot-Lower Triangler Heatmap
Read more...    More of same type...        More by same keywords...
3D suface displaying shapes of mountain before and after volcanic eruption
Read more...    More of same type...        More by same keywords...
Ternary contour plot with data point overlay
Read more...    More of same type...        More by same keywords...
Trellis Plots - 100 Percent Stacked Bars
Read more...    More of same type...        More by same keywords...
Analyzing metal binding to proteins via HPLC coupled online to sector-field ICP-MS
Read more...    More of same type...        More by same keywords...
Circular Dendrogram
Circular Dendrogram
Read more...    More of same type...        More by same keywords...
XYZ Contour plot with colormap from second Z and custom boundary
Read more...    More of same type...        More by same keywords...
Column and Bar Charts with Axis Table
Read more...    More of same type...        More by same keywords...
3D ternary surface with projection and label
Read more...    More of same type...        More by same keywords...
Asymmetric Correlation Plot
Read more...    More of same type...        More by same keywords...
Donut Chart, Doughnut Chart
Read more...    More of same type...        More by same keywords...
Heatmap with Significant Marks-Kendall
Read more...    More of same type...        More by same keywords...
Overlapped Bars
Overlapped Bars
Read more...    More of same type...        More by same keywords...
Heatmap with Tick Label Table
Read more...    More of same type...        More by same keywords...
How to use LaTeX app to add an equation in graph
Read more...    More of same type...        More by same keywords...
Heatmap with Labels
Heatmap with Labels
Read more...    More of same type...        More by same keywords...
Grouped Stacked Dot Plot
Read more...    More of same type...        More by same keywords...
Wire frame surface plot with transparency.
Read more...    More of same type...        More by same keywords...
Polar Graph for Electron Transitions
Read more...    More of same type...        More by same keywords...
Ridgeline with Datapoints
Read more...    More of same type...        More by same keywords...
2020 US Presidential Election
Read more...    More of same type...        More by same keywords...
Gradian scale polar scatter with X/Y error bar
Read more...    More of same type...        More by same keywords...
3D Waterfall with Line and Scatter
Read more...    More of same type...        More by same keywords...
Column Plot with Color Scale
Read more...    More of same type...        More by same keywords...
Notched box chart with outliers
Read more...    More of same type...        More by same keywords...
3D vector plots derived from worksheet XYZ data
Read more...    More of same type...        More by same keywords...
Fill Area Below and Above Curve
Read more...    More of same type...        More by same keywords...
Violin with Fixed-Width Sticks
Read more...    More of same type...        More by same keywords...
Ridgeline Chart
Ridgeline Chart
Read more...    More of same type...        More by same keywords...
Waterfall Plots with YZ Lines
Read more...    More of same type...        More by same keywords...
Population Pyramid Plot
Read more...    More of same type...        More by same keywords...
Multiple Surfaces in Same Layer
Read more...    More of same type...        More by same keywords...
Two-layer chart combining a histogram and a Japanese Candlestick plot to represent trading volume and open, high, low, and close prices of one stock over a five-month period.
Read more...    More of same type...        More by same keywords...
Fan performance curve for a forward curved utility blower.
Read more...    More of same type...        More by same keywords...
Grouped Column Scatter with Double Y
Read more...    More of same type...        More by same keywords...
Trend of COVID-19 Worldwide
Read more...    More of same type...        More by same keywords...
Box Chart with Histogram
Read more...    More of same type...        More by same keywords...
Change of Raindrop Spectra with Altitude
Read more...    More of same type...        More by same keywords...
Streamlines of Global Wind Movement
Read more...    More of same type...        More by same keywords...
Parallel Plot with Independent Axis Range
Read more...    More of same type...        More by same keywords...
Sankey Diagram of 2018 US Energy Flows
Read more...    More of same type...        More by same keywords...
Polar contour plot of semiconductor wafer thickness as a function of the radius in millimeters and the angle.
Read more...    More of same type...        More by same keywords...
3D Pie Chart with Different Thickness
Read more...    More of same type...        More by same keywords...
Sankey Diagram of Awarded Qld Government Contracts
Read more...    More of same type...        More by same keywords...
Waterfall plot with a single trace highlighed with different color.
Read more...    More of same type...        More by same keywords...
Waterfall with Smooth Lines
Read more...    More of same type...        More by same keywords...
Browser Histogram
Browser Histogram
Read more...    More of same type...        More by same keywords...
Correlation Heatmap with Divided Cells
Read more...    More of same type...        More by same keywords...
Dendrogram of Spectra Classification
Read more...    More of same type...        More by same keywords...
Butterfly parametric function plot
Read more...    More of same type...        More by same keywords...
Cluster Plot from Result Data
Read more...    More of same type...        More by same keywords...
Concentric Ring
Concentric Ring
Read more...    More of same type...        More by same keywords...
Tile Grid Map for Europe GDP Changes
Read more...    More of same type...        More by same keywords...
Grouped Scatter Plot
Read more...    More of same type...        More by same keywords...
Sine and Cosine Function Plots
Read more...    More of same type...        More by same keywords...
Multiple-layer presentation of data from magnetic analysis of alloy powders.
Read more...    More of same type...        More by same keywords...
3D colormap surface plot with skipped lines and missing values.
Read more...    More of same type...        More by same keywords...
Creating Histogram with Varying Bin Width
Read more...    More of same type...        More by same keywords...
Create a column Plot Starting from Non-zero Value
Read more...    More of same type...        More by same keywords...
Home Price Index Changes & Unemployment Rate
Read more...    More of same type...        More by same keywords...
How to Create a USDA-NRCS Soil Texture Ternary in Origin
Read more...    More of same type...        More by same keywords...
Histogram and probabilities chart: The histogram (Layer 1) provides the center, spread, and skewness of the data, while the probability plot (Layer 2) indicates whether the data follows a normal distribution.
Read more...    More of same type...        More by same keywords...
Distribution Curve with Rug
Read more...    More of same type...        More by same keywords...
Network Plot of Football Players
Read more...    More of same type...        More by same keywords...
Overlay of two contour plots.
Read more...    More of same type...        More by same keywords...
Smith chart graphing impedence in transmission lines.
Read more...    More of same type...        More by same keywords...
Colormap Sunburst Plot
Read more...    More of same type...        More by same keywords...
Multi-Vari Plot for MPG
Read more...    More of same type...        More by same keywords...
Circular Packing Graph
Read more...    More of same type...        More by same keywords...
Polar plot representing four dimensions: bubble size, color, direction and distance.
Read more...    More of same type...        More by same keywords...
3D Scatter plot combined with 3D Parametric Surfaces
Read more...    More of same type...        More by same keywords...
Browser Stacked Curves
Read more...    More of same type...        More by same keywords...
3D Surface with Special Contour Line and No Axis
Read more...    More of same type...        More by same keywords...
Surface with Custom Boundary
Read more...    More of same type...        More by same keywords...
3D XRD Waterfall in B&W
Read more...    More of same type...        More by same keywords...
Visualizing the Negative Log
Read more...    More of same type...        More by same keywords...
Bar of Pie Chart
Bar of Pie Chart
Read more...    More of same type...        More by same keywords...
Graph Browser for Stacked Layers
Read more...    More of same type...        More by same keywords...
Violin with Box
Violin with Box
Read more...    More of same type...        More by same keywords...
3D Colormap Surface with Point Label
Read more...    More of same type...        More by same keywords...
Contour + Streamlines
Read more...    More of same type...        More by same keywords...
Plot Stacked Contour Plots in a Cylinder Coordinates
Read more...    More of same type...        More by same keywords...
Overlay Locations on a 3D Map
Read more...    More of same type...        More by same keywords...
Contour profile plot
Read more...    More of same type...        More by same keywords...
This graph shows the calculated optical density of states of a superlattice as function of the photon energy and the electric field.
Read more...    More of same type...        More by same keywords...
Grouped Floating Bar
Read more...    More of same type...        More by same keywords...
Unbalanced Group Plot
Read more...    More of same type...        More by same keywords...
© OriginLab Corporation. All rights reserved.
× _ Let's Chat