Learn how to create this graph here.
Description:
This graph demonstrates the ability to use values from a second matrix to assign color map to a surface plot. The surface data is from a matrix with X, Y, and Z distance information. The second matrix has pressure values at each X, Y value, and these pressure values are used to create a color map for the surface.
The second matrix object needs to be in the same sheet as the first matrix, and thus have the same dimension and X, Y coordinate settings. Once the first matrix object is plotted as a color-filled surface plot, the Front Color control can be changed to map to values from the second matrix object. The Colormap tab can be used to assign a smooth palette of colors. Settings are also available to control the maximum number of X, Y grid lines.
 |
 |
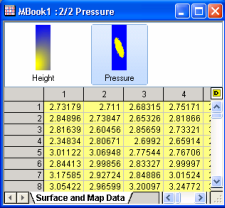
In this example, Matrix thumbnails have been turned on. Note that both matrix objects are in the same sheet, and the matrix object for plotting (Height) has a larger index than the one for color mapping (Pressure).
|
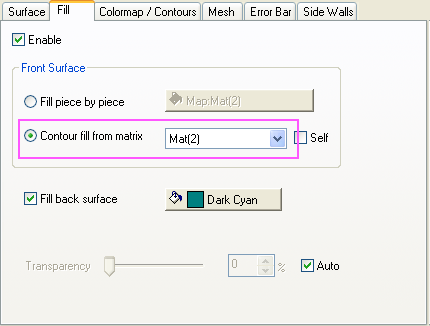
In Plot Details, go to Fill tab, select Contour Fill fron Matrix, then specify the matrix as Mat(2) . In this way, the second matrix can be used as color map.
|