Back to Top
OriginLab Corporation - Data Analysis and Graphing Software - 2D graphs, 3D graphs, Contour Plots, Statistical Charts, Data Exploration, Statistics, Curve Fitting, Signal Processing, and Peak Analysis      
Buy Now Try Demo
Skip Navigation Links.

Notched Box Chart with Fill Pattern and Outlier


Show more of same type...            Show more using same keywords...

Download this project to learn how to make the graph.


Description:

This graph charts fertility rates in the USA from 1980 to 2010. A notched box style with fill pattern is used, and outliers are shown in-line with the box.

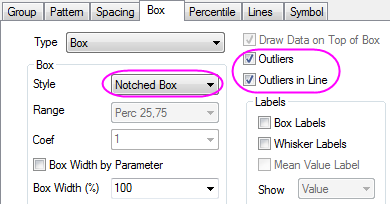
The notched box style and outlier display can be enabled in the Box tab of the Plot Details dialog box.

© OriginLab Corporation. All rights reserved.
× _ Let's Chat