
|
Skip Navigation Links.
|
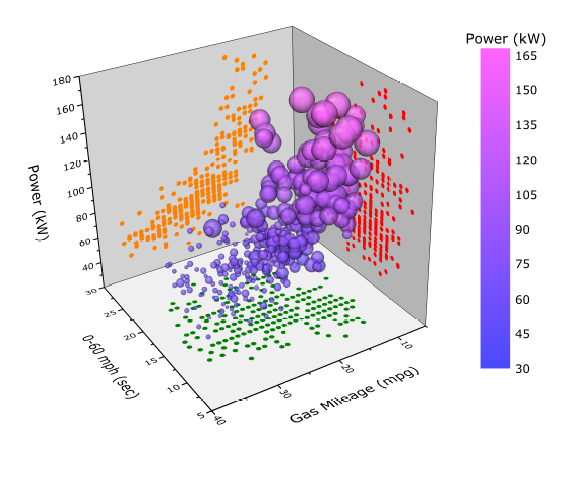
3D Scatter with Colormap
|
|
|
Show more of same type... Show more using same keywords...
Download this project to learn how to make the graph.
|
|
Description:
This graph shows a 3D scatter plot of automobile performance. The scatter size is proportional to Engine Displacement. The colormap based on Z value (Power) is used and transparency is introduced in the scatters. Also projections on all three axis planes have been enabled.
|