Peak Analysis
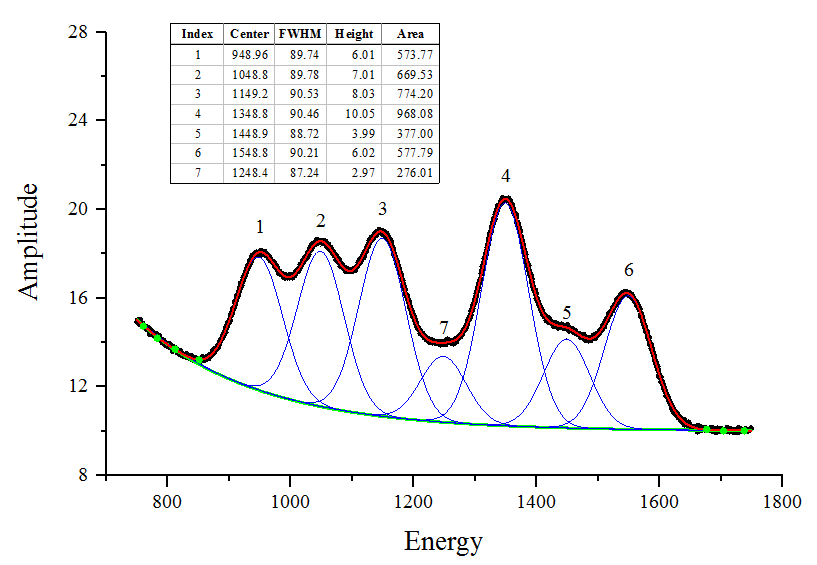
With Peak Analyzer, you can detect hidden or "convoluted" peaks and fit them with a baseline created by fitting manually picked anchor points.
Baseline Correction
Origin provides baseline detection and subtraction. Key features include:
Peak Finding/Determination
Peak Integration
In Origin, you can integrate data with multiple peaks, to obtain peak areas, FWHM and other peak characteristics. Baseline subtraction is supported before peak integration.
Available options include:
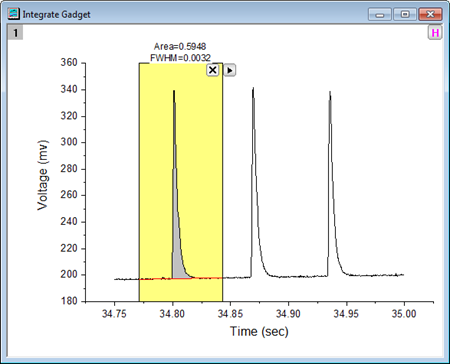
With the Integrate Gadget, you can graphically drag the ROI object to quickly view the area and FWHM results for each distinct peak.
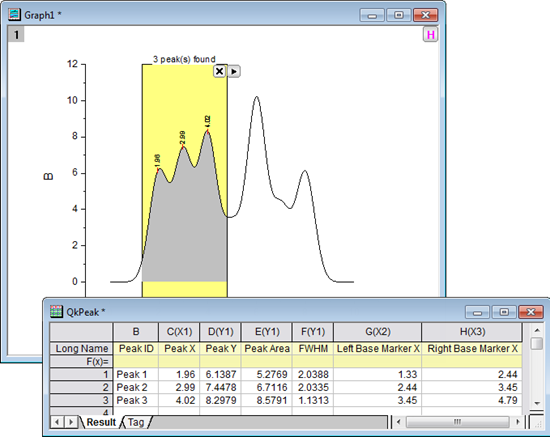
With the Quick Peaks Gadget, you can find both positive and negative peaks and output peak areas, FWHM, etc., for overlapped peaks. Optional peak fitting is supported.
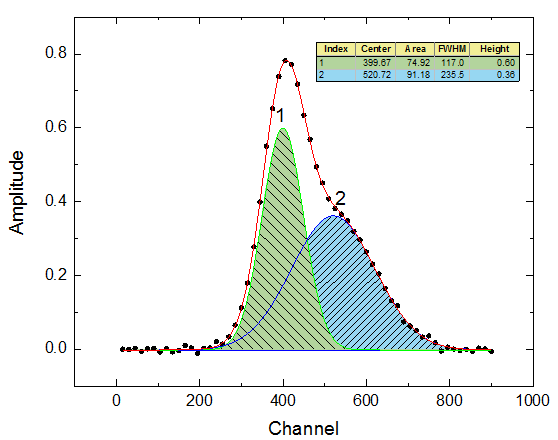
With Peak Analyzer, you can find and fit peaks to obtain fitted peak areas.
Peak Fitting PRO
Origin provides many tools to perform peak fitting:
Available options for peak fitting include:
Surface Peak Analysis PRO
Origin provides two ways to analyze peaks in 2D surface data:
- Perform surface peak analysis on image or contour plot
- Use ROI object to easily select area of interest
- Subtract base plane, and integrate
- Instantly view surface peak results on graph
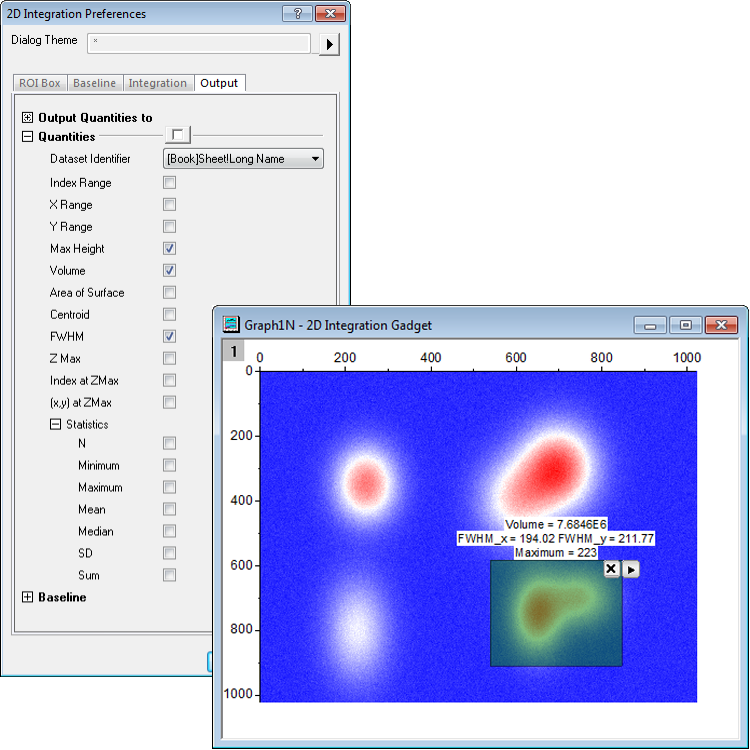
With the 2D Integration Gadget, you simply position the region-of-interest (ROI) on a target peak and instantly view surface peak results.
- Fit peaks with over 20 built-in functions or a user defined function
- Fit XYZ or matrix data from a worksheet or a graph
- Locate multiple peaks using one of many peak identification methods
- Apply bounds and to parameters, as well as fix desired parameters
- Find specific Z values at specific X, Y values using the fit surface
Time-Saving Peak Analysis Features
Origin provides a Batch Peak Analysis tool that lets you perform peak analysis on multiple datasets.
Batch Peak Analysis Using Theme
Manually analyze a typical dataset in Peak Analyzer, and save your custom settings to a theme file. Analyze multiple datasets using the your saved theme.
With the Batch Peak Analysis tool, you can:
Analyze Multiple Curves Using Gadget
Batch peak analysis is also available with the Quick Peaks Gadget:
- Visually perform analysis on region of interest (ROI)
- Easily switch peak function
- Subtract baseline for peak integration
- Quick analyze all curves in current graph layer or page
- Save settings as theme for repeat use
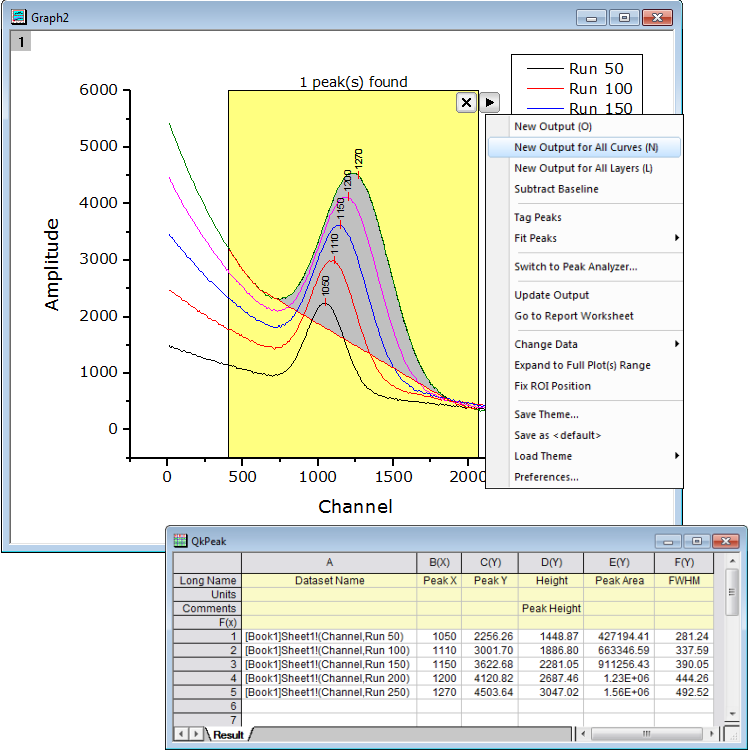
With Quick Peaks Gadget, you can use an existing curve as baseline and quickly output the analysis results for all curves in current graph.
Apps
Extend peak analysis functionality of Origin by installing free Apps from our File Exchange site. A selection of peak analysis Apps are displayed below.
Find More Apps>>