Back to Top
OriginLab Corporation - Data Analysis and Graphing Software - 2D graphs, 3D graphs, Contour Plots, Statistical Charts, Data Exploration, Statistics, Curve Fitting, Signal Processing, and Peak Analysis      
Buy Now Try Demo
Skip Navigation Links.

Changes in Home Price Index and Unemployment Rate


Show more of same type...            Show more using same keywords...

Description:

This graph is a combination of 3D bar and 3D scatter plots. Colormapping is introduced to both plots based on the Z value. The 3D bars represent the changes in Home Price Index, while the 3D scatters represent the unemployment rate. The data is from several Census Divisions in different years.

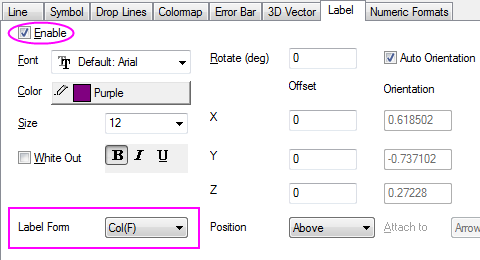
Use the unemployment rate to display data label.


© OriginLab Corporation. All rights reserved.
× _ Let's Chat