Description:
This graph displays an overlay of vector and fill area plots.
The continents were plotted as a fill area, and Fill Area Under Curve was set to Inclusive broken by missing values in the Plot Details dialog.
Directional ocean currents were graphed as a vector plot. The vector plot was created by importing data for latitude, longitude, direction, and speed of currents from a worksheet with X, Y1, Y2, and Y3 columns, and then choosing Vector XYAM from the Plot menu. The layers were then merged and superimposed.
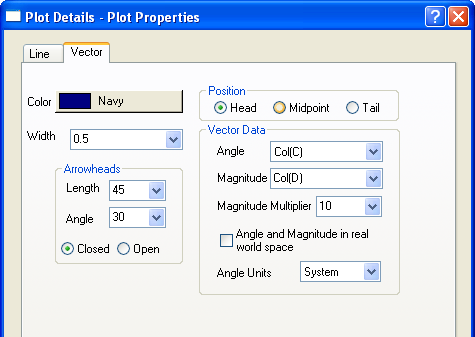
The Vector tab of the Plot Details dialog provides controls for manipulating vector color, vector data, arrow heads, and more.