Learn how to create this graph here.
Description:
This Open-High-Low-Close-Volume stock chart displays the open, high, low, and close prices of the stock (Oracle Corporation) over a period from 1/25/2001 to 7/3/2001. (The data was obtained from the following web page: http://www.google.com/finance/historical?q=NASDAQ:ORCL.)
The graph consists of two layers, stacked vertically. The upper Japanese Candlestick plot displays the opening, highest, lowest, and closing prices of a security over a given time interval, and the lower column plot shows the trade volume.
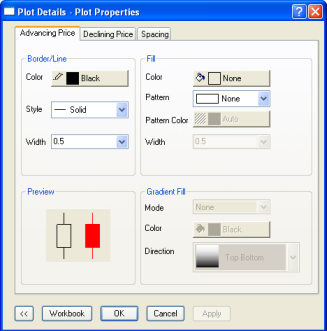
The Japanese Candlestick chart contains two different plot elements. The first (usually hollow) element represents a closing price that is higher than that trading day’s opening price. The second (usually filled) element represents a closing price that is lower than that day’s opening price. The appearance of these two elements can be controlled using the Advancing Price tab and the Declining Price tab in the Plot Details dialog box.

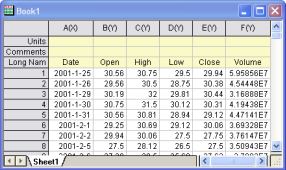
Source data should contain five columns: "Open", "High", "Low", "Close", and "Volume".
|

Use the Advancing Price and Declining Price tabs to control the Candlestick chart's appearance.
|