Back to Top
OriginLab Corporation - Data Analysis and Graphing Software - 2D graphs, 3D graphs, Contour Plots, Statistical Charts, Data Exploration, Statistics, Curve Fitting, Signal Processing, and Peak Analysis      
Buy Now Try Demo
Skip Navigation Links.

Unbalanced Grouped Box Plot


Show more of same type...            Show more using same keywords...

Description:

This Unbalanced Grouped Box Chart was created using indexed data and Grouped Box Chart from Indexed Data option.
The subgroup size is unbalanced: 2,3,3,2.

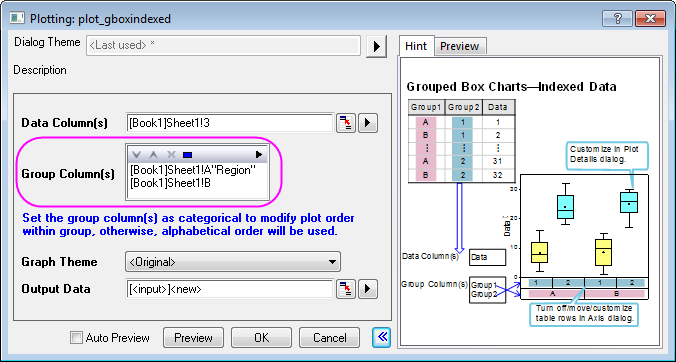
Highlight the dataset and select Plot: Statistics: Grouped Box Charts - Indexed Data in the menu.
Then you can custom the Group Columns and create the graph.

© OriginLab Corporation. All rights reserved.
× _ Let's Chat