1.237 FAQ-1015 How to customize Heatmap?
Last Update: 9/10/2019
heatmap-customize
Add Border for Each Cell
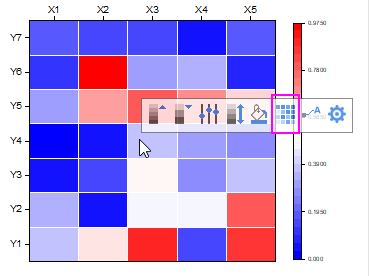
If you create a Heatmap from categorical XY values, you will find the Add Grid Lines button  when you click any cell on the Heatmap. You can click this button to add borders for each cell. when you click any cell on the Heatmap. You can click this button to add borders for each cell.
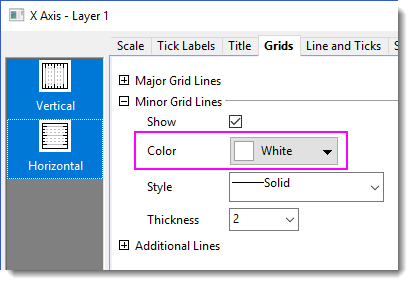
To further customize the border color and style, double click on the axis to open Axis dialog. Go to the Grid tab and change Minor Grid Lines, Color, Style and Thickness as needed.
Note that the Add Grid Lines button is available only when the Increment of both Major and Minor Tick of X and Y axis is set to “1”. If the button is not available on your Heatmap, you can
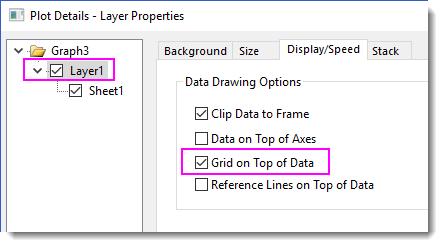
- double click on the graph to open the Plot Details dialog. Select Layer level on the left panel and go to the Display/Speed tab on the right. Select Grid on Top of Data checkbox in Data Drawing Options group.
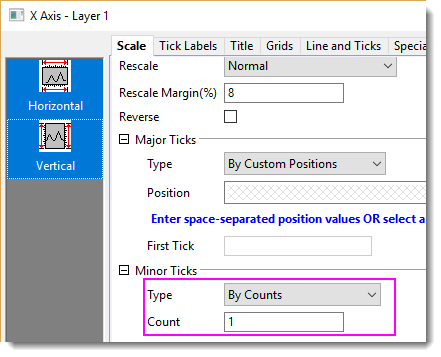
- Double click on axis to open the Axis dialog. Make sure the Increment of Major and Minor Ticks is 1.
- On the Grids tab, Show the Minor Grid Lines.
Another way to add border is adding gaps between cells.
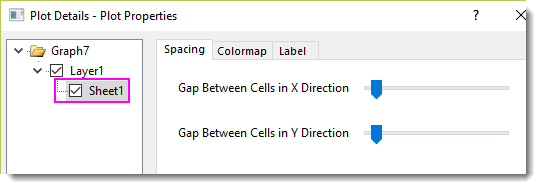
- double click on the graph to open the Plot Details dialog. On the Spacing tab, drag the slider of Gap Between Cells in X/Y Direction to a proper position.
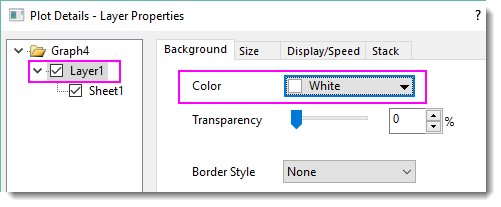
- Note that the gap is no color (transparent) by default. To set color for gap, select Layer level on the left panel and go to the Background tab on the right. Select a color from Color drop-down.
Add Custom Label for Axis Tick
If you plot a Heatmap from a virtual matrix, you can add custom tick labels as follow
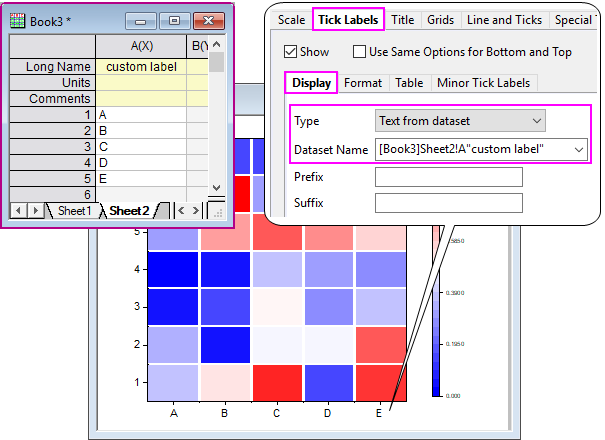
- Prepare your custom tick labels and put them in a new column.
- Open Axis dialog. Activate the Tick Label tab and then Display sub-tab. Select ext from dataset for Type and choose your label column for Dataset Name.
| Note:
Please do not use Column Name or Label type and put your custom label text in the column label row in the source worksheet. For a graph from virtual matrix, it cannot refer to the source worksheet.
|
Keywords:heatmap, border, grid lines, contour, label, boundary
Minimum Origin Version Required: 2019
|