1.139 FAQ-753 How to interactively show or hide plots on a graph?Object-Manager
Last Update: 9/12/2018
The Object Manager panel is useful for managing a number of high-level plot operations (e.g. hiding or showing plots) in the active graph window. The Object Manager is docked, by default, to the upper-right corner of your Origin workspace. If you do not see it, click View: Object Manager or press ALT+8.
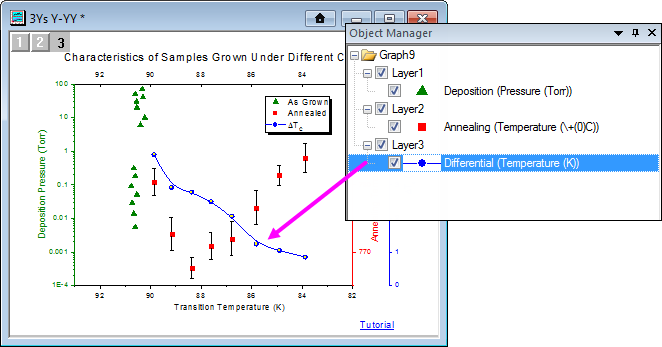
Click to select the plot on the graph and its corresponding entry will be highlighted in the Object Manager. There are several options for hiding or showing this plot in the graph.
In the Object Manager panel:
- Clear or check the box in front of the plot to hide or show.
- Right-click on the plot item to Show/Hide Plots of the Same Name.
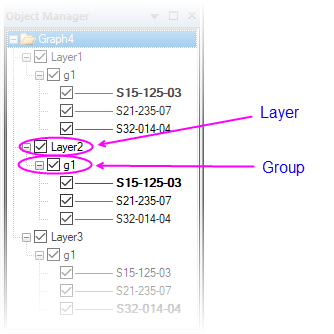
- You can also clear or check the box in front of (a) an entire group to hide or show that group or (b) a layer to hide or show that layer.
There are a number of other plot operations you can do using the Object Manager -- change plot order or plot type, define and manage plot groups, remove plots from the graph, move plots to another layer, etc. For more details, please see this page.
Keywords:Object Manager, Show, Hide, plot group, layers, move plots, remove plot, visualize
|