Batalyse - Automate Data Processing for Battery and Fuel Cells
Batalyse GmbH
Walzbachtal, Germany
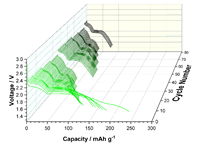
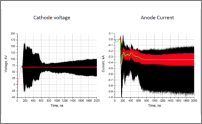
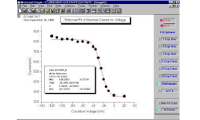
Batalyse-Data Analysis is an Origin app designed for battery and fuel cell scientists and engineers by Batalyse GmbH, Germany. The aim of Data Analysis is the fast and comprehensive evaluation of measurement data generated during the examination of materials, cells, modules, stacks and batteries, independent of cell chemistry. Data Analysis evaluates measured data independently of the applied measuring device, file format, structure and electrochemical method. |
 |
Batalyse GmbH
Walzbachtal, Germany |
Batalyse GmbH
Walzbachtal, Germany |
6/7/2023 |
Batalyse app, test data evaluation, electrochemical cycle test, battery cell |
Batalyse app |
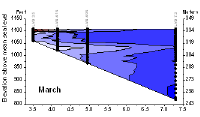
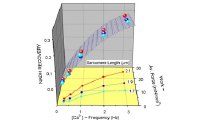
A Geochemical Tracer Method for Estimating Monsoon Withdrawal Date
Center for Climate Change Research,
Indian Institute of Tropical Meteorology (IITM), Pune, India
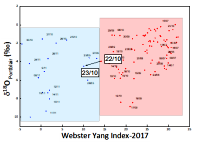
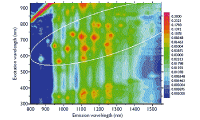
Because the southwest monsoon has broad economic and social impacts on life on the Indian subcontinent, there is considerable interest in predicting the onset and withdrawal dates of the monsoon. While the onset is easily indentified by distinct changes in key meteorological parameters (e.g. wind speed, rainfall), the withdrawal is characterized by slower changes in these parameters, making it difficult to identify a withdrawal date. Researchers have proposed a new method for dating the withdrawal that involves isotopic analysis of rainwater collected at sites in the Bay of Bengal and the Arabian Sea. |
 |
Meteorology, Clmate Studies, Atmospheric Sciences |
Climate Science |
11/28/2022 |
atmospher, monsoon, meteorology, climate, k-Means cluster, partial correlation, hydrological cycle, precipitation, isotopes, Indian Ocean, Webster-Yang, |
k-Means Cluster Analysis, Partial Correlation Analysis, Descriptive Statistics, Linear Fitting, Presentation Graphics |
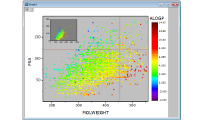
Using a Custom App to Characterize Calcium Transients in Patient-derived Cardiomyocytes
Department of Pharmacology and Therapeutics,
McGill University, Montréal, Quebec
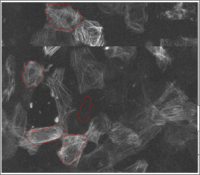
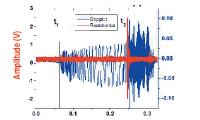
Cara Hawey is a Master's student in Hébert Lab, Department of Pharmacology and Therapeutics, McGill University in Montréal, Quebec. Her research focuses on use of patient-derived cardiomyocytes (induced pluripotent stem cells or iPSC-CMs) to characterize patient dilated cardiomyopathies. She describes her research and how she worked wtih OriginLab to develop a custom App to automate her data analysis. |
 |
Biomedicine, Pharmacology |
Biomedical Research |
4/6/2022 |
Pluripotent, stem cells, fluorescence, Paired Comparison, Apps, Python |
Custom-designed App, Paired Comparisons Plot App, Image to Matrix, Region Tool, Embedded Python, Statistical Graphs |
Studying the Influence of Climate Change on Season Characteristics
Sustainable Environment, Hamad Bin Khalifa University
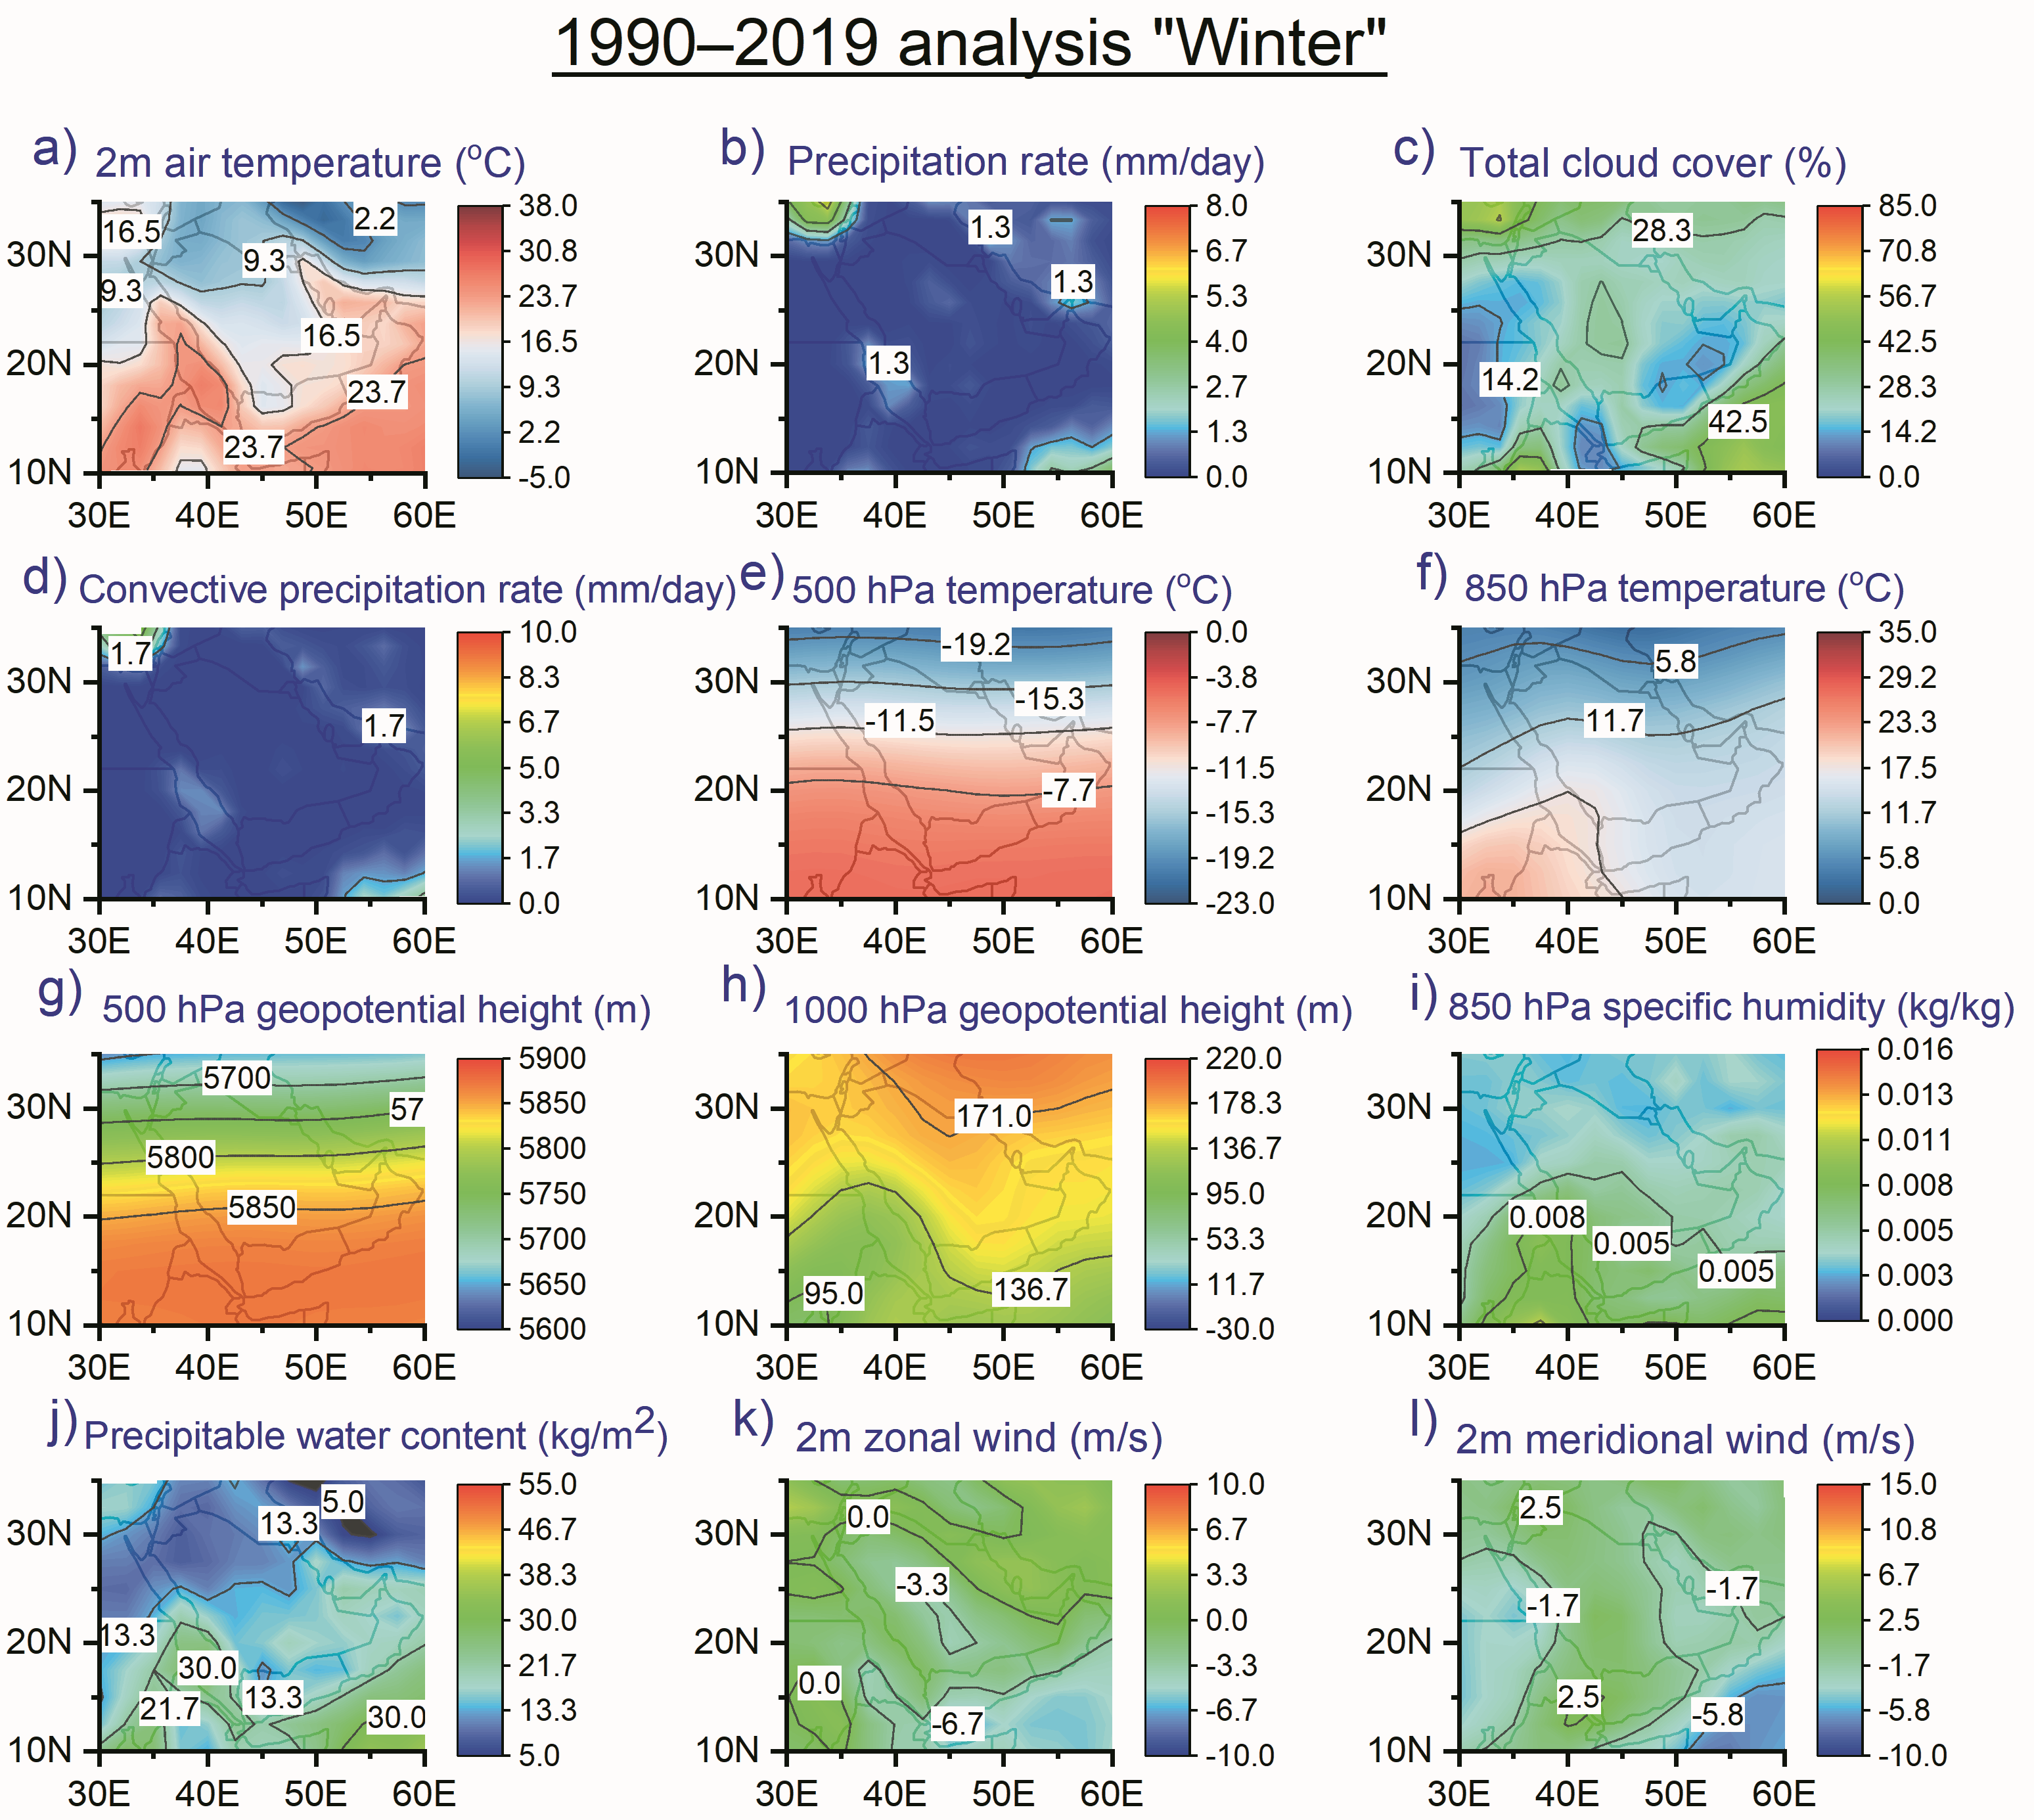
In the field of sustainable management of water resources in arid areas under climate and anthropogenic impacts, a key aspect is understanding season characteristics that are influenced by climate change and the impact this has on agriculture, ecosystems, etc. Salah Basem Ajjur, a PhD candidate at Hamad Bin Khalifa University, describes how Origin's new NetCDF features helped him in his investigation of variations in historic season characteristics. |
 |
Environmental Science, Climatology |
Climate Science |
5/13/2021 |
Climate Change, NetCDF, Python, |
NetCDF tools for easy import,analysis, and graphing, Embedded Python Support, Auto recalculation for analysis of new data files |
Origin Used in Ecology Field
Department of Ecology, Southwest University in Chongqing
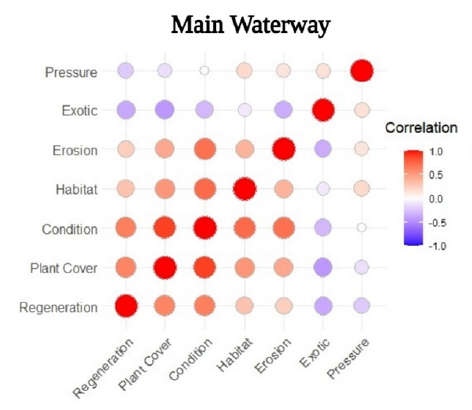
Muhammad Arif, a postdoctoral researcher in the Southwest University in Chongqing, China, uses Origin’s graphing and data analysis features to visually represent the findings of their study on the riparian zones of various water sources flowing into the Three Gorges Dam Reservoir (TGDR), China. |
 |
Ecology |
Ecology |
4/1/2021 |
Riparian zones, Pearson coefficient, correlation, |
Bar Charts, Box plots, Kruskal-Wallis tests, Principal Component Analysis, Correlations, Heat Maps, Agglormerative Hierchical Cluster Analysis |
Extracting Data from a Mobile Phone Video in OriginPro
Department of Physics, Washington State University
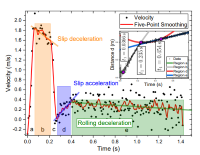
In their recent publication, Professor Mark Kuzyk and Maxx Hart present a series of lab experiments performed in a Classical Mechanics course, using the OriginPro Coursework License. Video recording of a cue ball collision was taken and the Video Data Extractor App in Origin was used as a tool to digitize the position of the cue ball, frame by frame. |
 |
Physics, Classical Mechanics |
Physics |
1/26/2021 |
Classical Mechanics experiments, Video Data Extractor App, at-home lab experiments, energy and momentum conservation, collisions, rollling and sliding friction, angular momentum, slipping torque, dissipative forces, cue ball collision experiment, collecting data with a mobile phone, extract data from a video |
Video Data Extractor App, Professional-Quality Graphing, Built-in C and Python, OriginPro Coursework License |
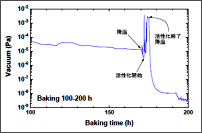
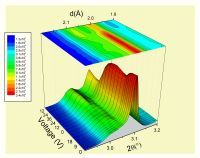
Fundamental Technology Research Institute, Tokyo Gas Co., Ltd.
Fundamental Technology Research Institute, Tokyo Gas Co. Ltd.
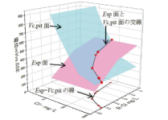
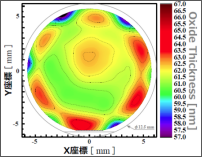
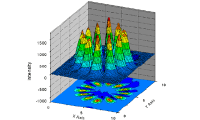
In homes and office buildings, stainless steel pipes are used to distribute gas and electrically-heated hot water. Depending on the water quality, in rare cases, these stainless-steel pipes corrode, causing holes to develop, Mr. Daikubara of the Fundamental Technology Research Institute of Tokyo Gas Co. Ltd. conducts research on the relationship between corrosion and water quality. The Research Institute recently added Origin as a research tool to improve 3-D graphing and analysis capabilities. |
 |
Engineering, Chemistry |
Utilities, Civil Engineering |
12/04/2019 |
pH, water-chemistry, materials, 3-D graphing, computation |
curve fitting, peak analyzer, transparency, 3-D graphing, 3D Surfaces Intersection App |
Volunteer Monitoring of Nuclear Contamination under the Sea
Tokyo University of Marine Science and Technology
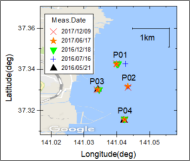
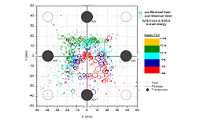
EcoStudies Association is a volunteer organization founded by Professors Emeritus Dr. Nobuhiro Shiotani and Dr. Hideo Ohashi, of the Department of Marine Environment at Tokyo University of Fisheries (renamed to Tokyo University of Marine Science and Technology). The group consists of around 40 members -- researchers, engineers and technicians -- who are mainly either retired or semi-retired, along with some additional young volunteers. The group's mission is to provide free professional expertise to local people - monitoring and assessing the radioactivity and its contamination in the area affected by the meltdown of the Fukushima Daiichi Nuclear Power Plant -- upon request. |
 |
Biology, Ecology, Environmental Sciences, Marine Science, Health Sciences |
Environmental Research |
8/14/2018 |
contamination, environmental, fisheries, Peak Analyzer, Google Map Import, data import, Fukushima |
Data Import, Peak Analyzer, Google Map Import App |
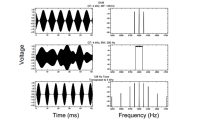
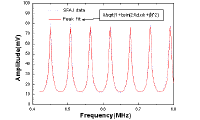
OriginPro in Studies of Microwave Signal Frequency Dynamics
Booz Allen Hamilton, Inc.
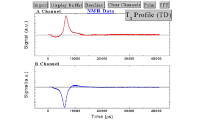
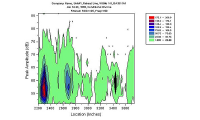
Dr. Andrey D. Andreev, Lead Engineer at Booz Allen Hamilton Inc., conducts research into the physics of magnetron operation. He shared results of a recent simulation and analysis study of the S-band coaxial VMS-1143B magnetron, manufactured by Communication & Power Industries’ Beverly Microwave Division. Dr. Andreev’s study of the VMS1143B magnetron entailed performing “cold” and “hot” simulations of magnetron operation, using three different computer codes, LANL's Poisson Superfish and ANSYS' HFSS for “cold” simulations and AFRL's ICEPIC for “hot” simulations. |
 |
Physics |
Research,
Physics |
6/14/2018 |
microwave, magnetron, Fourier Transform, FFT, signal processing |
Short-time Fourier Analysis
Signal Processing
Graphing
Graph Customization |
Origin in Studies of Placental Development During Human Pregnancy
Dept. of Cell & Tissue Biology, University of California, San Francisco
Matthew Gormley is a scientist in Susan Fisher's lab at the Center for Reproductive Sciences at the University of California, San Francisco (UCSF). The mechanisms by which human placental cells invade the uterus during pregnancy are a primary focus of Fisher Lab's research. Gormley studies trophoblasts, the specialized cells out of which the placenta is formed. The group is looking for ways to detect or prevent diseases of pregnancy like preeclampsia by comparing the activities of trophoblasts from normal pregnancies, with those in which symptoms of preeclampsia were observed. |
 |
Biology, Physiology, Medical, Health Sciences |
Biomedical Research |
11/08/2017 |
Health, Medical, Genetics, |
Trellis Plot, Two-way Repeated Measures ANOVA, Parametric Test, Non-parametric Test, Descriptive Statistics, Graphic Export, Presentation |
Origin Assists in Multi-item Small Scale Manufacturing Revolution
Nanoelectronics Research Institute
National Institute of Advanced Industrial Science and Technology (AIST)
Tsukuba, Japan
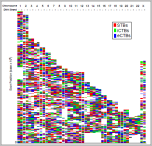
Dr. Shiro Hara is a research scientist at Nanoelectronics Research Institute of the National Institute of Advanced Industrial Science and Technology (AIST) in Tsukuba, Japan. For many years, his group has been working to find ways to reduce waste and improve efficiency in the semiconductor industry. In 2007, the group proposed to develop a small-scale chip manufacturing system that was not reliant on the large capital outlays and large-scale production that have characterized the growth of the semiconductor industry. In 2014, the group accomplished assembly of a full, working minimal fab system which is capable of producing simple devices (MMS, diodes, MOS, CMOS, etc.). |
 |
Electrical Engineering, Material Science, |
Semiconductors, Electronics |
8/28/2017 |
Contour Plot, Nonlinear Curve Fit, Graph Theme |
General Graphing
Contour Plots
Copying and Pasting Formats
Graph Themes
Nonlinear Curve Fitting |
Origin in U.S. Civil War Survival Analysis
Dept. of History, Old Dominion University and Cooper Medical School, Rowan University
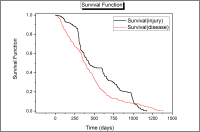
John Cameron, Ph.D. and Robert Hirsh, M.D. are, respectively, Adjunct Faulty member, Dept. of History at Old Dominion University in Norfolk, VA and Assistant Professor of Anesthesiology at Cooper Medical School of Rowan University in Camden, NJ. In this study, Cameron and Hirsh compiled data for each of 1500 soldiers of the North Carolina 30th Regiment which fought with Confederate forces in the American Civil War of 1861 - 1865. Cameron and Hirsh wanted to understand how factors such as age of enlistment or conscription, military rank, and social status affected a soldier's odds of survival. |
 |
History, Medical, Epidemiology, Health Sciences |
Research, Biomedical |
6/20/2017 |
Survival Analysis, Kaplan-Meier, Logistic Regression |
Kaplan-Meier Survival Analysis,
Logisitic Regression |
Origin in Multiscale Contact Mechanics
Becton Dickinson and Co.
Nestor Rodriguez , Ph.D, analyzes surface topography, to be used in multi-scale contact mechanics (MCM) and studies the effects of roughness asymmetry on the MCM analysis. |
 |
Material Science, Mechanical Engineering, Biomedical |
Research, Biomedical |
5/24/2017 |
Multi-scale contact mechanics, fractal dimension, Hurst exponent, affine transformation |
Curve Fitting
Signal Processing
Statistics
Profile Plots
LabTalk Scripting
Batch Analysis
Origin Apps (Hurst Exponent) |
Using Origin to Investigate the Brain Mechanisms that Regulate Eating Activity
Dept. of Oral Physiology
Showa University School of Dentistry
Tokyo, Japan
Professor Tomio Inoue and his group at the Department of Oral Physiology at Showa University School of Dentistry in Japan, study the brain mechanisms that regulate swallowing and masticatory activity, and masticatory muscle activity during sleep. Their research involves various studies using the latest equipment such as a two-photon excitation microscope, an optical recording system, patch-clamp devices, etc., and analyzing nerve activity in perfusing animals and masticatory muscle activity in freely moving mice. |
 |
Biology, Physiology, Medical |
Research, Biomedical, |
4/12/2017 |
pCLAMP, Biomedical, Peak Analysis, Graphics, Asterisk Bracket, |
Panel Graphs,
pCLAMP Import,
Publication-quality Graphs,
Layer Contents Dialog,
Asterisk Bracket for Statistical Plots |
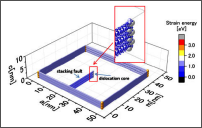
Visualizing the Simulation of Molecular Dynamics with Origin Graphs
Department of Mechanical Engineering
Graduate School & Faculty of Engineering
Mie University
Tsu City, Mie Prefecture, Japan
Molecular dynamics simulations are used to study atomic-level phenomena which are difficult to observe in an actual experiment. Using this technique, Research Assoc. Takahiro Kawamura and his team at the Department of Mechanical Engineering at Mie University in Japan, are studying crystal growth and crystal defects of wide-gap semiconductors and metals like TiAl alloy. |
 |
Engineering, Material Science |
Research, Physics, Material Science |
4/12/2017 |
Publishing, Crystallography, Semiconductors, |
Graph Customization,
Graph Templates,
Copy-Paste Formats,
Graphic Export,
Nonlinear Curve Fitting |
Using Origin for Visualization and Data Analysis of a Breakthrough Technology
Photo electron Soul, Inc.
Nagoya University Incubation Facility
Furocho, Chikusa-ku
Nagoya, Aichi Prefecture 464-0814, Japan
Photo electron Soul Inc., which started their business in July 2015, is developing the photocathode electron beam technology. Photocathode technology has been developed mainly at Nagoya University in Japan for more than 30 years. Photo electron Soul Inc.’s latest and specialized technology advances the electron beam system which can be embedded as a core device, in a wide range of industrial equipment such as electron microscopes, semiconductor manufacturing/testing equipment, and metal 3D printer. |
 |
Engineering, Physics, Manufacturing |
Research, Material Science, Engineering, Physics |
4/12/2017 |
Microscopy, Manufaturing, Fabrication, Nano, Electron Beam, Testing |
Point-and-Click Analysis,
Curve Fitting,
Graphing,
Python Connectivity, |
Origin Used in Energy Research at DuPont Central Research
Central Research and Development and Industrial Biosciences, E. I. du Pont de Nemours & Co., Wilmington, DE
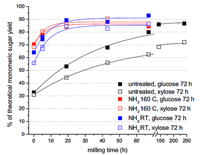
Bruce Diner is a recently-retired Senior Research Fellow with Central Research and Development and Industrial Biosciences, E. I. du Pont de Nemours & Co., Wilmington, DE. Bruce has used Origin for plotting kinetic, spectroscopic and chromatographic data in a wide range of studies including electron transport in photosynthesis, electronic properties of carbon nanotubes, enzyme activity assays, metabolite analysis following microbial metabolic engineering and, most recently, the use of gaseous ammonia pretreatment for decreasing the energy input required for fine milling in the conversion of lignocellulosic biomass to ethanol. |
 |
Biochemistry, Engineering |
Biotechnology |
3/23/2016 |
Biomass, Microbiology, Nonlinear Curve Fit, Agricultural Engineering, Applied Research, Renewable Energy, |
Publication-quality Graphs,
Nonlinear Curve Fitting,
Built-in and User-defined Fitting Functions,
Double Y plots,
Graph Axis Breaks,
Embedding of Editable Origin Graphs in MS Word and PowerPoint |
Using Origin in Studies of Energy and Electron Transfer for Solar Energy Conversion
John M. Papanikolas Group,
Department of Chemistry, University of North Carolina at Chapel Hill
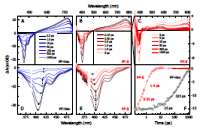
Zachary Morseth is a Ph.D. candidate at the University of North Carolina at Chapel Hill, and is a member of the Center for Solar Fuels. There, he employs ultrafast spectroscopic methods and computational tools to study energy and electron transfer dynamics in molecular assemblies for solar energy conversion. “Our group is primarily composed of spectroscopists and microscopists, so data analysis and visualization are extremely important to us. Origin provides our research group with a user-friendly interface for data processing (i.e., smoothing, scaling, etc.), curve fitting, and creating publication-quality figures." |
 |
Chemistry |
Chemical, Research, Material Science and Engineering |
9/22/2015 |
Polymer, Monomer, Solar, Spectroscopy, Energy, Spectral, Kinetics, Chromophore, |
Drag-and-Drop Data Import,
Math on Datasets,
Nonlinear Curve Fitting,
Global Fitting,
User-Defined Fitting Functions,
2D and 3D Graphing,
Descriptive Statistics
Data Binning |
Origin as a Tool for Studying Train-Handling Procedures
TÜV Rheinland Mobility Rail Sciences Division
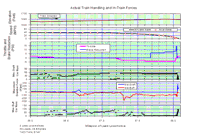
Jack Chislett of TÜV Rheinland Mobility Rail Sciences Division investigates train derailments and performs other train studies for most of the major railroads in the country. Recently, Jack was given the job of investigating a “break-in-two” that occurred during throttle-up on a long freight train. Working from client-supplied event recorder data, track profiles and train consists, Jack performed data pre-processing before inputting data to industry-standard simulation models. Results were then output to Origin for further graphical analysis and presentation. |
 |
Engineering |
Transportation |
9/9/2015 |
Train, Graphing, Handling, Operations, TUV Rheinland, Railway, Investigation, Simulation, Interpolation |
2D Graphs, 3D Graphs, Contour Graphs, Axis Linking, Graph Templates, Publication-quality Graphs |
Origin to Enhance Satellite Fleet Operations through Automation
Telesat (Leading Global Satellite Operator)
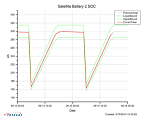
Steve Reid talks about how Teleseat a satellite communications company used Origin to automate routine fleet operation procedures such as tracking on-board subsystem health and performance to increase efficiency. Origin interfaced with Telesat's Scalable Data Management System (repository that retains telemetry data for all satellites) and effectively met all requirements for data handling, data throughput, and automated analysis and graphing. |
 |
Satellite Engineering |
Electronics |
1/16/2015 |
Satellite, Telemetry, Automation, Telesat, fleet operation, performance, monitoring, graphs, analysis |
Programming, Line and Symbol Plots, Curve Fitting, Signal Filters, Statistics |
Origin in Diabetes Research
Bryan Lab
Pacific Northwest Diabetes Research Institute
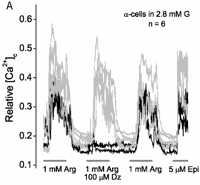
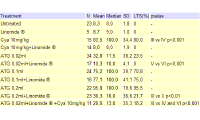
Joseph Bryan, Ph.D. is a Principal Scientist at the Pacific Northwest Diabetes Research Institute. His research has focused on the ionic mechanisms that underlie insulin secretion by pancreatic beta-cells in response to changes in blood sugar levels, particularly with respect to the role that ATP-sensitive K+ channels (KATP) play in the process. Dr. Bryan's group has used Origin to develop application-specific non-linear models and to prepare figures for publication in various journals. This case study highlights a recent paper on which Dr. Bryan was a principal investigator and co-author. |
 |
Biomedical Research |
Research |
1/16/2015 |
diabetes, insulin, Joseph Bryan, Object Linking and Embedding, OLE, graphing, publication, presentation, PowerPoint, MS Word, Layout, template, nonlinear fitter, curve fitting, pClamp, TIF, EPS, modelling, genetics, biology, biochemistry |
Statistics on Columns/Rows, Graph Templates, Nonlinear Curve Fitter, Layout Page, Publication-quality graphs |
Automating Financial Reports with Origin
Schroder Investment Management North America Inc.
Schroder Investment Management North America Inc. automated their quarterly report generation process by creating an Excel macro that inputs client data from spreadsheets into Origin. Here the data is added to existing graphs and then output as GIF images in a centralized location. COM scripts are also used to run the macro over each client's opj file. This minimizes the time and manual labor required for this process.
|
 |
Finance |
Finance |
10/17/2014 |
Automation, Schroder, Investment Banking, Quarterly Report, Quarterly Report generation, Excel Macro, COM Script, PowerPoint, Manual |
Labtalk, COM, graphing, automation, Line plot, fill area plot, export graph, labelling |
Origin for High Resolution X-Ray Spectrometer Prototype Testing
Brookhaven National Laboratory
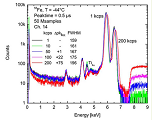
Dr. De Geronimo and his team used Origin in their research about the effect of varying conditions on the sensitivity of sensors on high resolution X Ray Spectrometers. Their aim was to increase the sensitivity of the sensors for clearer image retrieval as these spectrometers are designed to map planetary surfaces during space exploration. Origin's built-in fit functions were useful for extracting information from noisy or distorted curves. The team also used the Peak Analyzer feature for deconvoluting overlapping pulses, as well as the many graph customization features to represent their data. |
 |
Electrical Engineering |
Optics |
10/17/2014 |
BrookHaven, X-Ray Spectrometer, Optics, deconvolution, customizing graphs, space exploration, data representation, shoulder, pulses, light, frequency plot, events, Curve Fitting |
Import Wizard, Line and Symbol Plots, Curve Fitting, Peak Analyzer, Inset Graphs, Multi0Layer Plot |
Researching Effects of ATX Inhibition on Breast Cancer
University of Alberta, Department of Biochemisty
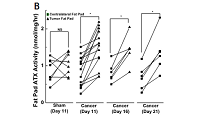
While he was an MD/PhD candidate at University of Alberta, Matthew Benesch and his team researched autotaxin (ATX), a secreted enzyme that promotes the circulation of certain lipids that increase the aggressive nature of cancer cells. Their research focused on breast cancer in particular, since breast cancer cells cause normal cells to accelerate the production of ATX. Using ONO-8430506 as an ATX-inhibitor, the research used both in vivo and in vitro models to determine the efficacy of the inhibitor on tumors and cancer cells in mice. |
 |
Biomedical Research |
Biotechnology, Pharmaceutical, and Medical |
8/11/2014 |
cancer, autotaxin, ATX, t-Test, ANOVA, significance asterisk brackets, multi-layer graphs, spectroscopy, curve-fitting, jitter plots |
t-Tests, One-way ANOVA, scatter plots, bar plots, column plots, significance asterisk brackets, inset graphs, multi-layer plots |
Origin for Acoustic Emission Testing
Southern Research Institute, Birmingham Alabama
Gregory Daspit a researcher at the Southern Research institute in Alabama, uses Origin as "... one of my go-to tools". In a recent project he used Origin to create a plot that to gives a visual and spatial picture of a modal Acoustic Emission Bending Test conducted on a circuit board . |
 |
Engineering |
research |
7/21/2014 |
2D symbol, scatter, size mapping, color mapping, acoustic, testing, Cartesian, research, emission, queries, |
Set Column Values, Queries, Color Mapping, Size Mapping, Stacking Plots, Push to PowerPoint |
Nonlinear Curve Fitting in Supramolecular Chemistry Analysis
Professor Bonizzoni, Department of Chemistry,
University of Alabama
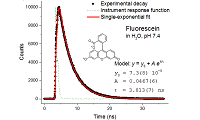
Professor Bonizzoni, an assistant professor in the Chemistry Departmentof The University of Alabama, is involved in the investigation of supramolecular chemistry. When Professor Bonizzoni's most recent research required fitting complex experimental data, he found that Origin's non-linear curve fitting feature outperformed other softwares and suited his purpose admirably. Here he talks more about his discovery and use of Origin. |
 |
Chemistry |
research |
7/11/2014 |
Chemistry, supramolecular, spectroscopy, Bonizzoni, University of Alabama, fitting function, deconvolution, NLSCURRINFO, decay, fluorescence, spectrometer, non-linear curve fitting |
Nonlinear Curve Fitting, Global Fit, Labtalk, User defined fit, Report Sheet |
Origin For Characterizing Bacterial Features as a Function of Age
Dr. Kristine Lang, Department of Physics
Colorado College
Dr. Lang and Dr. Lostroh use Origin for their research on the surface features of cells. Here they talk about a project involving the change in surface features as a function of age and how they used the myriad of graph templates in Origin to visually present the data in many different ways for a greater understanding of the research |
 |
Biophysics |
research |
04/24/2014 |
biology,physics,graphtemplates |
Graphing |
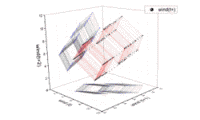
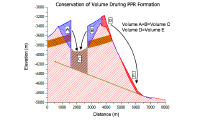
Calibrating Numerical Modeling Tools for Stress Profiles in Longwall Mining
Dr. Mark K Larson,Office of Mine Safety and Health Research (OMSHR) ,
National Institute for Occupational Safety and Health (NIOSH),
Centers for Disease Control and Prevention (CDC) (NIOSH)
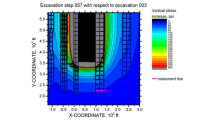
Dr. Mark K. Larson is a mining engineer who has been using Origin for the last eight years in his research for the CDC. Here he talks about utilizing Origin features such as automated Labtalk scripts and contour plots to calibrate numerical tools that profile stress distribution in underground long wall mines. |
 |
Geography, Earth Science |
Earth and Ocean Sciences |
02/07/2014 |
automation, LabTalk, script, multi-panel, contour, stack plot |
Graphing, Programming, Exporting, Importing, Programming |
Origin C++ for Theoretical and Experimental Research on Photo-regeneration
Dr. Mark Kuzyk, Department of Physics and Astronomy, Washington State University
Dr. Mark Kuzyk, a physics professor at Washington State University uses Origin extensively in his work. One of his projects concerns researching the process of reverse photo-regeneration in certain dyes. Here Dr. Kuzyk and his graduate students give us some insight into how Origin helped them create models for their data, plot them and thus visualize the process in order to draw appropriate conclusions. |
 |
Physics |
Astronomy |
02/07/2014 |
LabTalk, Origin C, C++, import, script, automation, external DLL, colormap, |
Graphing, Exporting, Importing, Programming |
Structure-property Characterization of Materials
Jason Nikkel, Dept. of Materials Science and Engineering, North Carolina State University
Jason Nikkel, a graduate student who works with Professor Jacob Jones at the North Carolina State University, uses Origin to compile and present data from the team's research on structure-property characterization of materials. Here he talks about creating publication quality graphs using the multi-axis and 3D graph features in Origin. |
 |
Chemisrty |
Material Science and Engineering |
01/16/2014 |
multi-axis, 3D, colormap, surface, export, inset graph |
Graphing, Data Manipulation, Exporting |
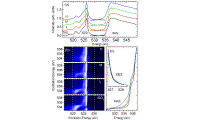
Quantum Research on materials with Optoelectronic Applications
Dr. Robert Green, Quantum Matter Institute University of British Columbia
Dr. Green, a post-doctoral research fellow at the University of British Columbia Quantum Matter Institute, uses Origin in his research on materials with potential optoelectronic applications. This article describes how he uses Origin to analyze vast amounts of data and then plots the results to compare samples. |
 |
Optics |
Electronics |
12/23/2013 |
import wizard, LabTalk, nonlinear curve fit, script, publication-quality graphs |
Programming, Graphing, Importing, Curve Fitting, Exporting, Analysis Template, Batch Processing |
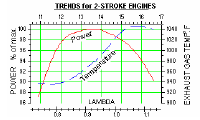
Using Origin to Plot Animated Graphs of Dynamic Time Dependant Climatic Variables
Professor Ray Huffaker, Institute of Food and Agricultural Sciences, University of Florida
Professor Huffaker uses Origin in his research on wind power project evaluations. In order to visualize how the data evolves with respect to time he used a LabTalk script to animate his 3D plot of wind speed patterns. |
 |
Biology |
Biotechnology, Pharmaceutical, and Medical |
12/05/2013 |
3D, LabTalk, Script, nonlinear curve fit,animation |
Programming, Graphing,Curve Fitting,Exporting |
Origin-LabVIEW Connectivity for Spectral Analysis
Johnny Perez, Center for Advanced Photonics Research, Temple University
Johnny Perez, a graduate student working with Dr. Robert J. Levis at Temple University, uses Origin-LabVIEW connectivity. Mr. Perez discusses how he utilized SubVIs provided by Origin to send experimental data to an Origin spreadsheet. |
 |
Chemistry |
Other |
11/20/2013 |
LabVIEW, SubVIs, import, Statistical Analysis, Graphing |
LabVIEW, SubVIs, Importing, Data Analysis, Graphing |
Origin for Modeling Axonal Terminal Populations in Neuroscience Research
Dr. Douglas Oliver, Department of Neuroscience, University of Connecticut Health Center
Dr. Douglas Oliver and his team use Origin for their research on the anatomy and physiology of the central nervous system.
This involves importing data and making use of Origin's vast graphing and analysis capabilities to process raw data and draw appropriate conclusions from the results |
 |
Neuroscience |
Other |
11/06/2013 |
import, pClamp, histogram, gaussian, frequency count |
Graphing, Importing, Image Processing, Peak Analysis, Exporting, Curve Fitting |
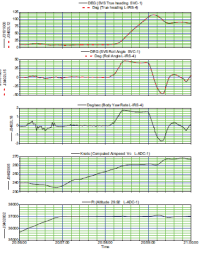
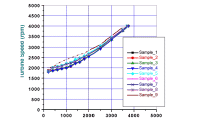
Bombardier's Flight Test Center uses Origin to Troubleshoot Flight Errors
By Erin Hatfield, Published October 1, 2013, Desktop Engineering
Researchers at the Bombardier Flight Test Center (BFTC) selected Origin to graph and analyze their aircraft flight test data. BFTC uses Origin to visualize its data and help isolate the cause of warning messages and other anomalies during real-world flight tests. Through a custom interface tailored to its workflow, BFTC imports, graphs and analyzes large volumes of data. Bombardier then makes system design changes as needed to its aircraft, during the development flight test phase.
"The custom Origin interface enables us to prebuild our datasets, move the data to and from specific locations, and call it up automatically," notes Michael Konicki, section chief with BFTC. "We can import data using the tool, modify the plots, apply templates, and then export them to PDFs, which we use in our reports ¨C all in a single solution. Any type of data that we need to report, we can adapt the custom interface to process that data, a practice that is much more complex in Excel and other software. The ease of plotting and integration into our data system are key components of the Origin system." |
 |
Engineering |
Aircraft |
10/08/2013 |
plotting, import, large dataset, custom interface, database, |
Graphing, Data Analysis, Programming, Importing |
Origin for Binaural Psychoacoustic Research
Dr. Leslie R. Bernstein, Department of Neuroscience and Surgery (Otolaryngology),
University of Connecticut Health Center
Dr. Leslie R. Bernstein and colleagues use Origin to analyze complex data for their research on binaural psychoacoustics. They import multi-thousand-point time-waveform as Origin allows the rapid importing and plotting of large scale data sets. |
 |
Neuroscience |
Other |
09/24/2013 |
import, logarithm scale, axis, axis break, multi-panel |
Importing, Graphing, Exporting |
Teaching Chemistry Students Data Analysis and Graphing Skills
Dr. Jay Deiner, Chemistry Department, NYC College of Technology, City University of New York
Dr. Deiner uses Origin to teach students how to analyze and present data in his Instrumental Methods of Analysis (CHEM 3412) course. "One of the most important skills in CHEM 3412 is learning how to process the data that comes from scientific instruments (and in fact appreciating that you must process data in detail to gain maximum information from it). ... Up until this course, students have typically only used Excel for graphing, and Excel is not adequate for spectroscopic or chromatographic data." |
 |
Chemistry, Spectroscopy |
Other |
06/19/2013 |
Multi-Panel Graph, peak height, peak area, plotting, |
Graphing, Importing, Peak analysis, Exporting |
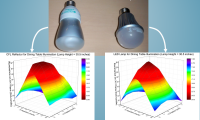
Analyzing Illuminance Data in LED Lighting Technology
Dr. M. Nisa Khan, President and Managing Member, IEM LED Lighting Technologies
Dr. Nisa Khan uses Origin 3D surface plots to compare illumination quality of LED, fluorescent, and incandescent lamps for her book on the science of LED lighting technology. |
 |
Physics, Electrical Engineering, Optics |
Semiconductor |
05/21/2013 |
3D, Surface, plotting, colormap |
Graphing |
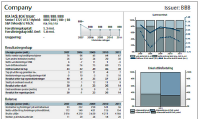
Origin as a Financial Reporting Tool
Ariel Fischer, Quantitative Analyst, SpareBank 1 Markets AS, Oslo, Norway
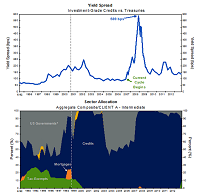
Ariel Fischer and his team from SpareBank 1 Markets AS in Oslo, Norway used Origin to create a fully automated reporting tool. This tool has been used to create a credit rating report of 150 Nordic banks. |
 |
Finance |
Financial Services |
01/15/2013 |
Finance, Custom Report, Publication, Layout, Automation |
Programming, Graphing, |
Origin for Lab Course at University of Tulsa
Dr. Alexei Grigoriev, University of Tulsa, Oklahoma, USA
Dr. Alexei Grigoriev from the Department of Physics and Engineering Physics at the University of Tulsa integrates Origin into lab exercises, allowing students to practice programming functions, nonlinear curve fitting, and data presentation, all in one software environment. |
 |
Physics |
Other |
01/15/2013 |
Origin C, code builder, LabVIEW, nonlinear curve fit, |
Curve Fitting, Graphing, Programming |
Dissolved Solids Circulation in Las Vegas Bay, Lake Mead, USA
Prof. Dr. Michael R. Rosen, University of Nevada, Reno, USA
Dr. Michael R. Rosen from the Department of Geological Sciences and Engineering in University of Nevada leads a research which is aimed to determine how the overall dissolved solids (measured as specific conductance) entering Las Vegas Bay from a tributary called Las Vegas Wash changed over the year. Origin is used in this research to organize experimental data and plot color filled contours. |
 |
Earth Science |
Earth and Ocean Sciences |
11/21/2012 |
contour, color filled contour, data organization, |
Graphing, Data Manipulation, |
Molecular Images - Creating Images from SMILES Strings
A chemist and Origin user at a leading global health care company utilize a third-party DLL and additional Origin C code to convert the Simplified Molecular-Input Line-Entry Specification(SMILES) data to images of the chemical structures. |
 |
N/A |
N/A |
03/29/2012 |
data, Origin C, code builder, external DLL, data information, data reader, worksheet, string |
Graphing, Programming, |
Planetary Science - Plotting and Using Integrate Gadget
Jason Nycz, Geophysicist and Planetary Scientist
Geophysicist and planetary scientist Jason Nycz uses Origin to statistically catalogue craters by type and location, and to integrate crater profile data in a process known as palinspastic restoration. |
 |
Earth Science |
Earth and Ocean Sciences |
05/16/2011 |
region, ROI, template, graph, integrate, gadget, plot |
Graphing, |
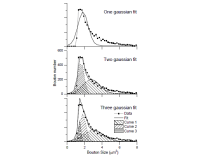
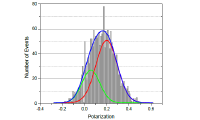
Muscle Use - Producing and Fitting Histograms
Julian Borejdo, University of North Texas Health Science Center
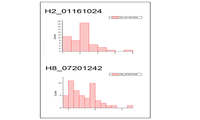
Julian Borejdo at the University of North Texas Health Science Center uses Origin for statistical analysis, visualizing frequency information in histograms and using non-linear curve fitting to identify modal behavior in the data. |
 |
Biochemistry |
Biotechnology, Pharmaceutical, and Medical |
03/05/2011 |
Histogram, frequency count, nonlinear curve fit |
Curve Fitting, |
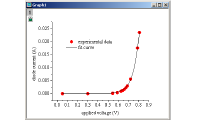
Patterned Energy - Performing Simulations in the Area of Non-Linear Optics
Shoresh Shafei and Mark Kuzyk, Physics Department at Washington State University, Washington, USA
Shoresh Shafei and Mark Kuzyk in the Physics department at Washington State University are using Origin to perform simulations in the area of non-linear optics, use Origin's unique project explorer to organize gigabytes of simulation data, Origin's analysis tools for computation, and multi-panel graphing capabilities to present results. |
 |
Physics |
Semiconductor |
1/27/2011 |
large datasets, project explorer, multi-panel graphing, data analysis, |
Curve Fitting, Data Manipulation, Graphing, |
Global Nonlinear Curve -Fitting Using Origin
Dr. Dylan Bulseco, Director of Assay Development, Sensor Technologies
Dr. Dylan Bulseco, director of Assay Development at Sensor Technologies, uses non-linear curve fitting tool in Origin to fit user defined functions, and do global fitting, in order to analyze data from biochemistry. |
 |
Biochemistry |
Biotechnology, Pharmaceutical, and Medical |
5/7/2010 |
nonlinear fit, global fitting, independent, |
Curve Fitting, |
Automated Analysis of pClamp Data in Origin
Professor Alexander Zholos, Vascular Biology at Queen's University Belfast, UK
Professor Alexander Zholos from Vascular Biology Department at Queen's University Belfast, UK used Origin to automate the process of Importing pClamp file directly from instrument, and analyzing the data automatically with Labtalk script. |
 |
Biology,Biomedical science |
Biotechnology, Pharmaceutical, and Medical |
7/1/2009 |
pCLAMP, Labtalk, script, |
Graphing, Programming, |
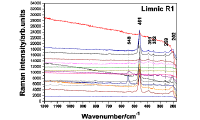
Micro-Raman Spectroscopy of Complex Nanostructured Mineral Systems
S. Cînta Pînzaru and D. Pop, Babes-Bolyai University, Cluj-Napoca, Romania
S. Cînta Pînzaru and D. Pop from Babes-Bolyai University generate line plots with Origin to illustrate the acquisition of Raman data from various range of datasets, and compare measured data with reference, also carry out simple peak analysis. |
 |
Earth Science |
Earth and Ocean Sciences |
4/29/2008 |
Raman, line plot, spectroscopy, peak analysis |
Graphing, Data Manipulation, Baseline and Peak Analysis, |
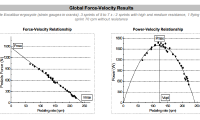
Using Analysis Templates to Produce Custom Reports for High-Level Athletes and their Trainers
Antoine Couturier and Sylvain Dorel, National Institute of Sport, Paris, France
Antoine Couturier and Sylvain Dorel, researchers at the Laboratory of Biomechanics and Physiology at the French National Institute of Sport, use the analysis template in Origin to do repeated analysis for similar data, and generate custom report sheet easily for trainers and athletes to review progress in their training regimens. |
 |
Biology,Physiology |
Biotechnology, Pharmaceutical, and Medical,Chemical |
3/31/2008 |
Analysis Template, report sheet, repeat analysis, save, custom report sheet, re-use, future use |
Analysis Templates, Data Manipulation, |
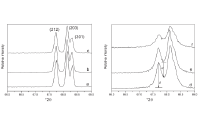
Metamorphic Effects on Agate Found Near the Shap Granite
T. Moxon et al, Department of Earth Science, University of Cambridge, UK
T. Moxon et al generate line plots for IR adsorption spectra, Raman spectroscopy and ternary plots with Origin for their paper publication. The paper is publlished in Mineralogical Magazine. |
 |
Earth Science |
Earth and Ocean Sciences |
2/11/2008 |
plot, line plot, ternary exporting graphs |
Curve Fitting, Exporting, Graphing, |
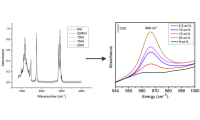
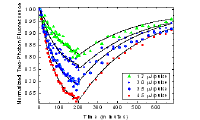
Two-Photon Fluorescence Measurements of Reversible Photodegradation in a Dye-doped Polymer
Ye Zhu, Juefei Zhou, and Mark G. Kuzyk, Washington State University, Washington, USA
Ye Zhu, Juefei Zhou, and Mark G. Kuzyk are from Department of Physics and Astronomy,
Washington State University. They import multiple experiment data files with import wizard , plot them with a user-defined template, carry out linear regression and export the graph as certain format with Origin. In this case, the graph is used to interpret and show molecules' degrade. |
 |
Lasers,Optics,Physics,Polymers |
Biotechnology, Pharmaceutical, and Medical |
5/2/2007 |
import wizard, save, template library, template, user-defined, plot, linear fit, export, EPS |
Analysis Templates, Graphing, Importing, |
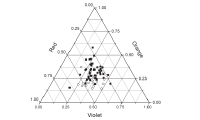
A Cathodoluminescence Study
T. Moxon et al, Department of Earth Science, University of Cambridge, UK
T. Moxon et al generate ternary plots and many other graph types with Origin for paper publication. The paper is published in Mineralogical Magazine. |
 |
Earth Science |
Earth and Ocean Sciences |
2/9/2007 |
Ternary, plot, graph, exporting graphs |
Curve Fitting, Graphing, Exporting, |
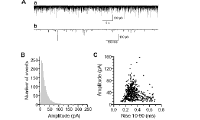
Properties of mPSCs at the C. elegans Neuromuscular Junction
Qiang Liu and Zhao-Wen Wang , Department of Neuroscience, University of Connecticut Health Center
Qiang Liu and Zhao-Wen Wang from Department of Neuroscience, University of Connecticut Health Center import pClamp data into Origin, plot them with several layers, and arrange the layers to form a proper designed graph. The analysis is to determine whether large-amplitude mPSCs were due to synchronized release of multiple synaptic vesicles. |
 |
Biology,Electrophysiology,Microbiology,Neurobiology,Structural Biology |
Biotechnology, Pharmaceutical, and Medical,Chemical |
11/3/2006 |
arrange layers, pCLAMP, Plot Setup,size, |
Graphing, Importing, |
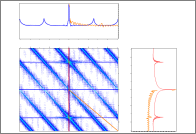
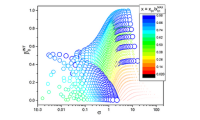
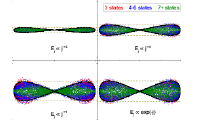
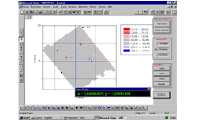
Analyzing the Electronic States of a Heavily Overdoped High Temperature Superconductor
The J. C. Davis Group, Laboratory of Atomic and Solid State Physics at Cornell University
The J. C. Davis Group, Laboratory of Atomic and Solid State Physics at Cornell University conducts a research project, in which they import the line cut data from the STM control software using Origin's ASCII data Import Wizard, convert the combination to a matrix and generate a 3D colormap surface plot. |
 |
Physics |
Semiconductor |
6/30/2006 |
colormap, surface, Import Wizard, conversion, matrix data, worksheet, direct, |
Graphing, |
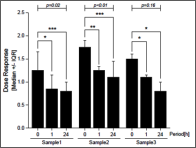
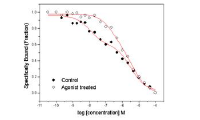
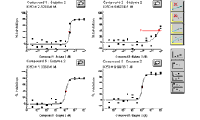
Automated Dose Response Curve Fitting Outpaces Manual Operation
AstraZeneca, Alderley Park, UK
AstraZeneca (Alderley Park, UK) has developed a customized data processing application in Origin that can analyze up to 2,000 datasets per hour, an improvement of 50 to 100-fold over the number that scientists could analyze using previous methods. |
 |
Pharmaceutical/Pharmacology,Physiology |
Biotechnology, Pharmaceutical, and Medical |
5/24/2005 |
large datasets, nonlinear curve fit, built-in |
Curve Fitting, Programming, |
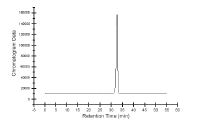
A Compositional Heterogeneity Method to Simplify LC Data Analysis
Susan Goodchild and Jeff Hurlbut at Solutia, Inc, Springfield, USA
Susan Goodchild and Jeff Hurlbut at Solutia, Inc. design a customized routin to automate calibration and curve fitting to analyze polymer compositional distribution liquid chromatography data. |
 |
Analytical Chemistry, Chromatography,Polymers |
Chemical |
4/7/2005 |
Labtalk, Data Analysis, tool, button object, custom, |
Baseline and Peak Analysis, Curve Fitting, Programming, Statistics, |
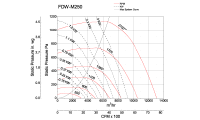
A Customized Application for Greenheck Fan
Greencheck Fan Corporation, Schofield, WI, USA
OriginLab's Application department, in cooperation with Greenheck Fan Corporation, has developed a custom fan curve application and interface to replace an existing and cumbersome interface and set of Fortran routines. They use Dialog Builder and Origin C to created a dialog that presents a series of options that allow the engineer to chart the performance of a particular fan. |
 |
Electrical Engineering |
Electronics, Industrial Automation and Machinery |
12/17/2004 |
Code Builder, Origin C, template, custom, exporting graphs, database |
Exporting, Programming, |
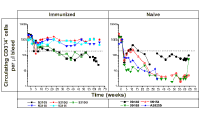
AIDS Vaccine Development
Nadeem Sheikh, Washington National Primate Research Center, Washington, USA
Nadeem Sheikh at the Washington National Primate Research Center and a group of other researchers collate, organize, statistically analyze and visually display a wide variety of disparate and diverse data sets which include such things as cell immunophenotyping, clinical parameters, virus loads, and basic body and weight measurements. |
 |
Biology,Immunology,Microbiology,Pathology,Physiology |
Biotechnology, Pharmaceutical, and Medical |
5/28/2004 |
Project Explorer, organize, multiple datasets, linear fit, polynomial fit, two sample t-test, exporting graphs |
Curve Fitting, Exporting, Statistics, Graphing, |
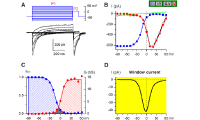
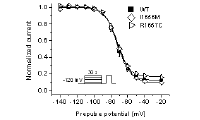
Discovering the Mysteries of Epilepsy Using pClamp Analysis
Vanderbilt
The researchers at Vanderbilt import and plot pClamp data, as well perform nonlinear curve fitting with Origin, and then build a mathematic model to characterized the Na+ channels in the research of epilepsy. |
 |
Biochemistry,Biology,Electrophysiology,Neurobiology,Pathology,Physiology,Structural Biology |
Biotechnology, Pharmaceutical, and Medical,Chemical |
4/2/2004 |
pClamp, nonlinear fit, import, plot |
Analysis Templates, Curve Fitting, Importing, |
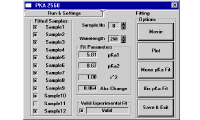
Automating pKa Curve Fitting Using Origin
Brian Bissett, Scientist, Pfizer Global Research & Development, Groton, USA
Brian Bissett, a scientist at Pfizer Global Research & Development, automates the nonlinear curve fitting process with Labtalk script based analysis tools to fit the pH curve and calculate the pKa curve. |
 |
Biology,Pharmaceutical/Pharmacology,Spectroscopy |
Biotechnology, Pharmaceutical, and Medical,Chemical |
3/24/2004 |
nonlinear fit, Labtalk, script, analysis, tool |
Curve Fitting, Programming, |
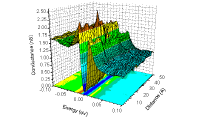
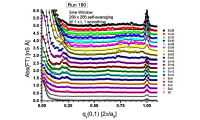
Mapping the Density States of a Superconductor as a Function of Energy
The Seamus Davis research group , University of California at Berkeley and Cornell University, USA
The Seamus Davis research group at the University of California at Berkeley and at Cornell University uses Origin C and Labtalk script to create button objects for the purpose of importing, manipulating, fitting and plotting data from 2D Fourier Transform electron density maps. |
 |
Physics,Solid State Physics |
Semiconductor |
3/18/2004 |
Origin C, code builder, button object, import, plot, graph, Labtalk, script, nonlinear fit |
Curve Fitting, Graphing, Programming, |
Research in Spacecraft Propulsion Technology
The Propulsion Research Center at NASA/MSFC, USA
The Propulsion Research Center at NASA/MSFC creates Origin graphs to visualize research results of technologies for use in "in-space" propulsion of spacecraft and publish them as part of presentations or paper publication. |
 |
Electrical Engineering,Physics |
Aerospace and Defense,Communications |
3/10/2004 |
line plot, multiple Y, graph, custom, exporting graphs, PDF, presentation |
Exporting, Graphing, |
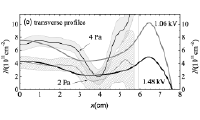
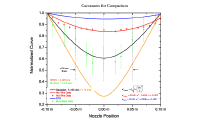
Multiphysics Displayed in Origin 7.5: Laser Synthesis of Nanoparticles
Dr. James Gardner, consultant in nanotechnology and multiphysics engineering, Environmental Instruments, Corp.
Dr. James Gardner, a consultant in nanotechnology and multiphysics engineering, creates presentation quality graph with Origin to show comparison between theoretical, computation and experimental results, which helps to design a nozzle that had a top-hat velocity profile (not the standard laminar parabolic) relative to the focused laser beam thickness. |
 |
Lasers,Optics, Physics |
Instrumentation |
3/4/2004 |
presentation, graph, exporting graph,custom |
Curve Fitting, Exporting, Graphing, |
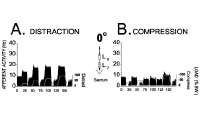
Effect on Sensory Nerves by Vertebral Column Movement
Joel G. Pickar, Neurophysiologist,Palmer Center for Chiropractic Research, Davenport, Iowa. USA
Joel G. Pickar is a Neurophysiologist at the Palmer Center for Chiropractic Research in Davenport, Iowa. He makes presentation quality graphs with Origin to visualize both biomechanical and neurophysiological data, helping to understand how mechanical movement of the vertebral column affects sensory nerves that innervate the paraspinal tissues. |
 |
Biology,Neurobiology,Physiology |
Biotechnology, Pharmaceutical, and Medical,Chemical |
3/2/2004 |
presentation, graph, exporting graphs, column graph, arrange, drawing object, layout |
Data Manipulation, Graphing, Exporting, Programming, |
Simplifying Carbon Nanotube Identification
Professor R. Bruce Weisman, the Center for Nanoscale Science and Technology, Rice University
Professor R. Bruce Weisman, a member of the Center for Nanoscale Science and Technology and the Center for Biological and Environmental Nanotechnology at Rice University, displays and analyzes large files of data and search for underlying patterns using dozens of worksheets in project files, some of which totaled several megabytes, which helps to characterize carbon nanotube structure in a simpler way. |
 |
Physics,Spectroscopy |
Biotechnology, Pharmaceutical, and Medical,Electronics,Semiconductor |
01/01/2004 |
large datasets, worksheet, project explorer, graph, colormap, surface, 3D |
Graphing, |
Bubble-Based Chemical Sensing for the Process Industries
Naveen Neil Sinha, Los Alamos High School, NM, USA
Naveen Neil Sinha was in his junior year at Los Alamos High School when he carried out a research in which he uses both Origin's built-in tool and user-defined analysis tool to determine resonance frequency from Fourier transform result of the Doppler instruments, and plot the data on the speed of the bubble over time. |
 |
Physics |
Chemical,Other |
10/2003 |
FFT, 2D FFT, resonance frequency, Origin C, custom, STFT, scientific phase |
Graphing, Programming, Signal Processing, |
Experiments Increase Understanding of Chronic Obstructive Lung Disease
Dr. Bengt Kayser, Research Fellow, McGill University, Montreal, Canada
Dr. Bengt Kayser and co-researchers at McGill University quickly visualize and analyze their data with Origin from the research of chronic obstructive lung disease, even possible to analyze data during experiment. |
 |
Biology |
Biotechnology, Pharmaceutical, and Medical,Chemical |
01/01/2002 |
analysis, data, graph, plot, quick analysis, |
Baseline and Peak Analysis, Graphing, |
Heart Differences Between Neonatals and Adults
Prof. Dr. Craig Clarkson, Tulane University School of Medicine, New Orleans, Louisiana, USA
Professor Craig Clarkson and his co-workers at Tulane University School of Medicine were investigating the physiological differences of heart tissue samples obtained from newborn and adult patients. They make use of Origin to speed up the data analysis by writing scripts and automate processes. |
 |
Biology,Cardiology,Pathology,Pharmaceutical/Pharmacology,Physiology |
Biotechnology, Pharmaceutical, and Medical,Chemical |
01/01/2002 |
pCLAMP, large dataset, script, user-defined, analysis, tool, statistics, significance level |
Statistics, Importing, Programming, |
Automating Chart Production Reduces Time Required to Produce Reports
Templeton Global Investors, Incorporated
Templeton Global Investors, Incorporated uses Origin to produce complex over/under chart which enables the client to examine in a clear and concise manner a comparison of their investments to major investment indicesautomatically. |
 |
Finance |
Financial Services |
01/01/2002 |
bar graph, custom, Labtalk, script |
Graphing, Programming, |
Get Your Engineering Point Across With More Descriptive Charts
Ralph Lombard, President, Lombard Technical Consulting, Charlotte, North Carolina, USA
Ralph Lombard of Lombard Technical Consulting generates charts/graphs impact with abundant information which enable engineers to get visualized explaination of testing results.etc. Origin is favored especially for its multi-layer and multi-axes charts feature. |
 |
Engineering |
Instrumentation |
01/01/2002 |
chart, graph, arrange, |
Graphing, Programming, |
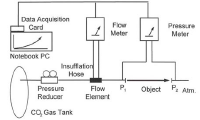
Study Shows That $250 Million Could Be Saved In Laparoscopic Surgery
Dr. Volker R. Jacobs, Christian-Albrechts-University, Kiel, Germany
Origin increased the ease of producing regression curves that prove the statistical validity of the results from research of improving gas flow into the patient's abdominal cavity. This was extremely useful for the research of Dr. Volker R. Jacobs and his colleagues at Christian-Albrechts-University |
 |
Biology,Clinical Medicine |
Biotechnology, Pharmaceutical, and Medical,Chemical |
01/01/2002 |
fit, fitted curve, regression, graph, exporting graphs, presentation |
Curve Fitting, Graphing, Programming, |
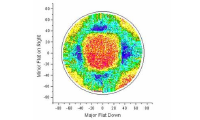
Graphics Script Provides Quick Classification of GaAs Wafers
Dr. Millard G. Mier, Research Physicist, U.S. Air Force Research Laboratory,
Ohio, USA
Dr. Millard G. Mier from the U.S. Air Force Research Laboratory wrote a LabTalk script to perform the necessary analyses and create color plots automatically from Infrared transmission topography results. |
 |
Semiconductor Physics |
Communications,Semiconductor |
01/01/2002 |
Labtalk, script, graph, plot, analysis, tool, custom |
Graphing, Programming, |
Push-button Analysis Aids Study of Leading-Edge Battery Technology
Eric Sigmund, Northwestern University Evanston, Illinois, USA
The ability to push a button and instantly perform otherwise tedious data analysis tasks in Origin has streamlined the study of electrolytic materials used in batteries for Eric Sigmund from Northwestern University. |
 |
Electrical Engineering,Magnetism |
Chemical, Industrial Automation and Machinery,Utilities and Energy |
01/01/2002 |
button object, analysis, tool,NMR |
Graphing, Programming, Signal Processing, |
Customized Acoustical-Analysis Programs Speed Delivery of Critical Information
Mark Ferdinand, President On-line Digital Technologies, Inc.
Carmichael, California, USA
A new custom acoustic-emission analysis program based on Origin is designed as a button object, relieved Mark Ferdinand and coworkers in On-line Digital Technologies from enormous manually data selection work. |
 |
Physics,Spectroscopy |
Semiconductor |
01/01/2002 |
button object, analysis, tool, cluster, Labtalk, script |
Analysis Templates, Graphing, Programming, |
Italian Research Laboratory Analyzes Instabilities in Carbon Dioxide Lasers
Marco Ciofini and Riccardo Meucci, Researchers, National Institute of Optics, Florence, Italy
The researchers from National Institute of Optics in Florence, Italy use Origin to store and graphically depict the data generated by the measurements of intensity variations through the cross-section of the carbon dioxide laser beam and over time. |
 |
Lasers,Optics |
Instrumentation |
01/01/2002 |
3D, contour, colormap, surface, spectroscopy |
Graphing, Signal Processing, |
Study Demonstrates Synergistic Effects of Drugs in Facilitating Transplants
Dr. Michael Olausson, Goteborg University, Goteborg, Sweden
Origin helps researchers at Goteborg University to produce charts that quickly and clearly communicate the results of the charts to those who may be able to use them to reduce the side effects experienced by transplant patients. |
 |
Biology,Immunology,Pharmaceutical/Pharmacology,Physiology,Structural Biology |
N/A |
01/01/2002 |
chart, worksheet, report, custom, report sheet, |
Analysis Templates, Graphing, |
Custom Application for Ford, Reduces Graphing of Transmission Testing Data
Ford Motor Company
Engineers at the Ford Motor Automatic Transmission Testing Center use Origin to create series of plot with different variables for every sample in a same graph, and make it easier and more visualized to compare test data in the automotive engineering field. |
 |
Automotive Engineering |
Automotive |
01/01/2002 |
plot, graph, multiple Y, |
Graphing, Programming, |
Researchers Study Cardiac Energetics with Fluorescence Spectroscopy
Dr. Rolf Brandes, Loyola University Chicago, Illinois, USA
The research led by Dr. Rolf Brandes at Loyola University is aimed to understand how energy production is regulated in the heart when energy consumption suddenly changes. Origin is useful mainly for its nonlinear curve fitting tools and extensive multivariate regression analysis capabilities, also the Labtalk programming. |
 |
Biology,Cardiology,Physiology,Spectroscopy |
Biotechnology, Pharmaceutical, and Medical,Chemical |
01/01/2002 |
nonlinear fit, multivariate, analysis, Labtalk, tools, script, nonlinear regression |
Curve Fitting, Graphing, Programming, |
Powerful Data Analysis Routine Helps Locate Buried Bombs
Christian Barthel, Vice President, Barthel & Schreiber GmbH, Duisburg, Germany
In order to detect possible underground bombs, a software package is developed within Origin by Christian Barthel's team in Barthel & Schreiber GmbH along with Ralf Rosenberger from ADDITIVE. This software package could read the GPS signal, keep track of the tractor's position and provide course correction information to the driver. |
 |
Environmental Engineering, Oceanography |
Earth and Ocean Sciences |
01/01/2002 |
Origin C, dll, Labtalk, script, |
Graphing, Programming, |
New Analytical Method Helps Verify Chemical Weapons Compliance
Dipen N. Sinha, Los Alamos National Laboratories, Los Alamos, USA,
Nearly every capability of Origin was used on a daily basis to help Los Alamos National Laboratory verify chemical weapons compliance. |
 |
Fluid Dynamics,Physics,Spectroscopy |
Aerospace and Defense |
01/01/2002 |
peak fit, zoom, panning, Labtalk, analysis, tool, script |
Baseline and Peak Analysis, Curve Fitting, Programming, |
Robust Data Analysis Using OriginLab's Origin and LabTalk
Brian Bissett, Pfizer Global Research and Development, Groton, CT, USA
The book Practical Pharmaceutical Laboratory Automation includes a section on data analysis in Origin using Labtalk. |
 |
Pharmaceutical/Pharmacology |
Biotechnology, Pharmaceutical, and Medical |
01/01/2002 |
Labtalk, analysis |
Programming, |