Fundamental Technology Research Institute, Tokyo Gas Co., Ltd.
Organization
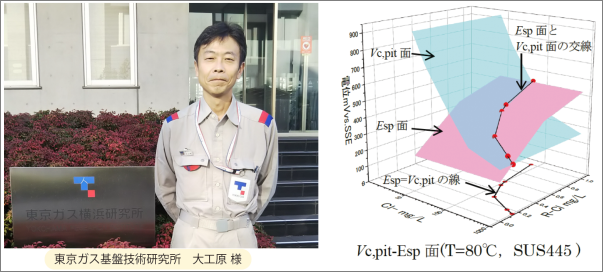
Mr. Daikubara
Fundamental Technology Research Institute
Tokyo Gas Co., Ltd.
Problem
To summarize results of corrosion experiments, researchers at Tokyo Gas Co. were calculating and drawing separate 2-D graphs. However, they realized that by plotting in 3-D space, they could project the intersection of 2-D plots onto a third plane, allowing them to more effectively understand data relationships.
Solution
Using OriginLab's free add-on 3D Surface Intersection App, researchers at Tokyo Gas were able to achieve their goal of plotting intersecting surfaces in 3-D space and projecting that intersection onto a third plane.
“
Not only do we have the graphing capability to visualize the engineer's ideas, but we think that Origin can also satisfy diverse needs and requests from our customers and from other groups within our company, owing to the various computational capabilities of Origin worksheets, similar to Excel, plus features such as curve fitting, and peak analysis.” - Mr. Daikubara
The following case study was submitted by Japanese Origin distributor LightStone Corporation . LightStone has provided sales and support for the Japanese-language version of Origin, for twenty years. We thank them kindly for giving permission to publish this case study on our website.
In homes and office buildings, stainless steel pipes are used to distribute gas and electrically-heated hot water. Depending on the water quality, in rare cases, these stainless-steel pipes corrode, causing holes to develop, Mr. Daikubara of the Fundamental Technology Research Institute of Tokyo Gas Co. Ltd. has conducted research and published papers on the relationship between corrosion and water quality and has demonstrated that these rust holes shouldn't be produced in a pH-neutral, warm water environment.
He has been looking for an effective way to present the data using 3-D graphs.
The Research Institute has recently added Origin to this research project, OriginLab Japanese distributor LightStone International recently visited the research lab to learn how well Origin is working, and ask about things which might improve Origin.
Problem: How to Compute the Intersection Line of Two 3-D Surfaces
LightStone: First, could you please tell us how you began to use Origin to in your research?
Mr.Daikubara: Sure. In the past, we have calculated and drawn two independent 2-D graphs separately from the data of two different corrosion experiments. However, we have realized that showing the 3-D projection of the shared line of two intersecting surfaces to the bottom plane would be more effective for visualizing data relationships. Although for a while we have made tried to get such projections using Excel, it was very hard to develop a good algorithm to calculate such a 3-D intersection. Later, we asked a supplier of technical software and they suggested that Origin should be able to do such a task.
“
We realized that showing the 3-D projection of the shared line of two intersecting surfaces to the bottom plane would be more effective .... we saw a test demonstration of Origin and indeed it did the job with no trouble.”
- Mr. Daikubara
Honestly, we were not sure whether it would really do the job as we would like. But, we saw a test demonstration of Origin, and indeed it did the job with no trouble. So, we decided to have the software to use in our lab. Another advantage of Origin's 3D graphing is the capability to present the 3D structures with transparency control.
Satisfying Diverse Demands
LightStone: In your real actual situation with your real data, did our software do a good job?
Mr.Daikubara: Yes, indeed. We have presented our research results including these graphs in the Proceedings of the 65th Panel Discussions in Environmental Areas of the Japan Society of Corrosion Engineering. In contrast to the past presentations which were done just in a conceptual way, our new visual presentation was very effective at conveying the meaning of the experimental analysis to the audience. Not only do we now have the graphing capability to visualize the engineer's ideas, but we think that Origin can also satisfy diverse needs and requests from our customers, and from other groups within our company, owing to the various computational capabilities of Origin worksheets, similar to Excel, plus features such as curve fitting and peak analysis.
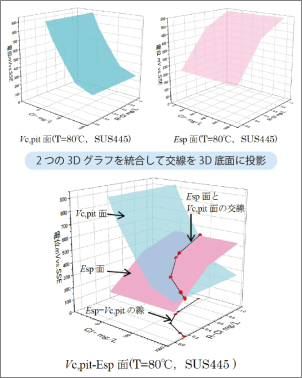
Figure 1: Combining Two 3-D Surface Plots (above), then Projecting their Shared Line to the Bottom Plane (below).
|
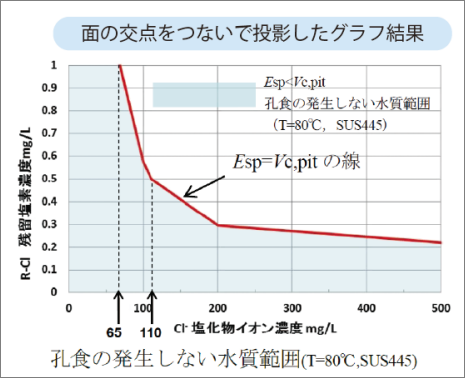
Figure 2: 2-D Line Plot Created by Connecting Points on the Intersecting Line.
|
Requesting New Features in Origin
LightStone: Do you have any requests to for any feature or service in Origin software?
Mr.Daikubara: In the cases of other software, we have often experienced that even when we,as individual users come up with a new good idea for a useful feature in the software, our minor voices usually don't reach the software developers or the company, thus the idea is never implemented. So, we would like to ask you what your experience is with implementing user requests in the case of Origin?
LightStone: Based on the actual user's requests, OriginLab has developed and published many free, downloadable Origin "Apps" so that user can add only desirable apps to Origin. You are welcome to request any new desirable feature in Origin, and we are happy to consider to develop a new app to implement the feature. To submit such a request, you can just click the "Request a New App" button in the App Center inside Origin (Editor's Note: To open the App Center, press the F10 key).