|
Origin plays a part in both the research laboratory and the class room for Kristine Lang, a physics professor and Phoebe Lostroh a biology professor both at Colorado College. Dr. Lang and Lostroh and their team primarily investigate cellular characteristics using Bacterium Actinetobacter Baylyi (A. baylyi). Their most recent project focused on characterizing the shape and surface features of the bacteria as a function of age using AFM imaging techniques. (Fig1) *.
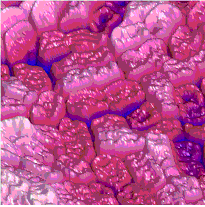
Figure 1. Image of bacterial cells
The team imaged and examined over one thousand cells, and categorized each as belonging to one of seven cell types (Figure 2 top). In addition, the physical characteristics such as length, width, height and elevation for each type of cell were measured by an external software and the data was then imported into Origin. The characteristics particular to each category were represented in a column plot (Fig.2 bottom). Having investigated the surface characteristics and cell type relationship, the team then recorded the changes in each of these characteristics as a function of time after innoculation in fresh broth. The results were visually represented with symbol plots, line plots, error bars, fitted curves and histograms to depict different aspects of the data, two examples of which are presented in Figure 4. In this case, stacked column and area plots were used to concisely represent how the distribution of cell types varied with time after innoculation.
Another aspect of the project involved determining the distribution of cell shapes as a function of time after innoculation. For this analysis, the researchers performed built-in normality tests for the elevation, length and width data distributions. The results, conveniently out put by Origin as histograms along side numerical results, suggested that while length is related to individual cell age, width and elevation are relatively invariant with cell age (Fig 3).
Dr. Lang says: “We have used lots of the graphing features in Origin to visualize this complicated data from many different perspectives and get a handle on the dataset.”
This project evolved into a grant proposal the team recently won. This grant allows Dr. Lang and her colleagues to explore natural competence, the phenomenon of a cell capturing and importing DNA in its external environment. Forty three candidate genes will be used to investigate the genetic basis of why specific genes are relevant for competence to certain cells. The results of each gene can be plotted in multi-panel graphs, or analyzed using stack column plots for easy comparison. The team will also explore other factors such as the way cell competence changes over the cell growth cycle, and the effect of the external DNA concentration.
*All data shown in this paper are preliminary data and do not represent final results.
| |
| Organization Department of Physics Colorado College |
| Problem To image and analyze bacterial surface features and present data in different ways for better visual understanding
|
| Solution Used different Origin graph templates to provide comparisons and correlations between measured characteristics and parameters.
| | Key Features
|
Another part of the project will focus on how the process takes place by researching the number and incidence of uptake machinery and cellular appendages present on each competent cell using AFM. Origin will be used to show the different aspect of this phenomenon though analysis and professional quality graphs. Part of this project also involves expanding the research into a freshman level class also using Origin.
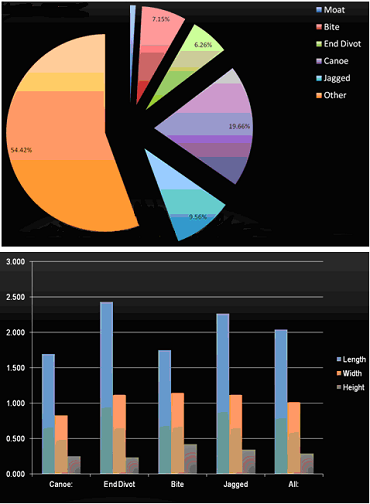
Figure 2. Top: Demography of over 1000 cells by cell type
Bottom: Cell type of surface characteristics.
|