Quantum Research on Materials with Optoelectronic Applications
|
Dr. Robert Green, a post-doctoral research fellow at the University of British Columbia Quantum Matter Institute, has been using Origin for his research needs since he was an undergraduate student. With Origin he can import data files in many different formats. This is convenient as he works with several experimental setups that provide output in various formats. Additionally Dr. Green uses Origin to set up analysis templates and perform batch operations to speed up data analysis.
During his recent Ph.D. studies at the University of Saskatchewan, Dr. Green worked on research related to the potential use of silica glass (SiO2) embedded with Manganese (Mn) and Cobalt (Co) atoms in optoelectronic applications. This project required modeling the placement of the atoms in the SiO2 and correlating this to the changes in the electronic and optical properties of the material. Dr. Green plotted the output of simulations in Origin as concentration depth profiles with depth on the X-axis and damage events and ion concentration on the Y-axes (Figure 1).
| |
|
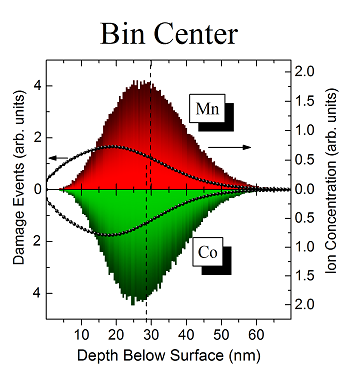
Figure 1. The concentration depth profile graph
X-ray absorption and scattering techniques with synchrotron light sources were used to study the material. Dr. Green used Origin to extract the data from ASCII files, and plot graphs depicting the experimental absorption. These curves were plotted alongside curves created using the calculated values, in panel graphs (Figure 2). Comparing the two helped pinpoint the locations of the ions in the silica glass.
|
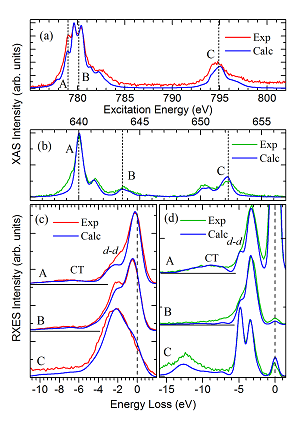
Figure 2. The stacked plot comparing the experimental and calculated values to pinpoint the positioning of the atoms in the silica
|
The change in electronic properties between samples with varying amount of atomic implants, and no implants was compared by creating contour plots. (Figure 3) The first graph shows curves for samples with High (H), Medium (M) and Low (L) doses of Mn and Co, and the black curve represents the control. The graphs depict sample absorption (XAS) and emission (XES). Stacking the plots made it easier to spot the subtle differences between them. In Figure 4 changes in the optical properties of the samples were gauged by plotting luminescence. The peaks were fit with the built-in Gaussian function to exhibit the various levels of luminescence. The “Add Inset Graph” feature was also useful since Dr. Green could compare intensities of important bands by zooming in on relevant parts of the graph.
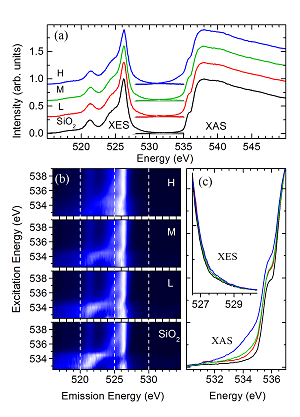
Figure 3. Stacked contour plots depicted the subtle differences in electronic properties of various samples
Dr. Green says:
“Origin has a large amount of features which allow you to display data in a very professional way. I have used Origin to create graphs and other figures for every one of my scientific publications…. I use at least some of the multitude of various data processing features available in Origin on a daily basis.”
|
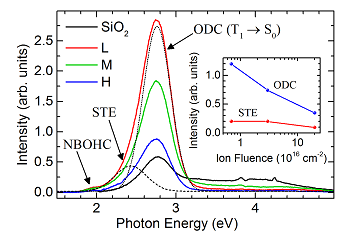
Figure 4. Plotting luminescence and fitting with the built in Gaussian function. The Inset graph was useful for comparing intensities
In the future Dr. Green intends to research properties at interfaces between materials, where many special phenomena can occur. This project will also require x-ray scattering. Dr. Green plans to use Origin to extract, organize and analyze the vast amounts of data that will be generated. Along with analysis templates and batch processing, he hopes to explore LabTalk scripting for automation.
|