By Alexander Zholos, Professor of Vascular Biology at Queen's University Belfast, UK
Voltage-operated ion channels show both “activation” and “inactivation” behavior. Measurements of steady-state activation and inactivation of L-type calcium channels predict the existence of a steady calcium influx over a certain voltage range which, among other vital functions, is an important determinant of smooth muscle tone.
We use whole-cell patch clamp techniques to examine calcium currents in single smooth muscle myocytes. The double pulse voltage protocol shown in panel A reveals voltage dependence of calcium channel activation (pulse 1, before step channels are not inactivated) and inactivation (pulse 2, channels are inactivated during pulse 1). A “window” current exists at potentials whereby ion channels are already activated but not yet fully inactivated. This condition is present within a region under the intersection of activation and inactivation curves (shaded area in panel C). Data analysis involves constructing current-voltage relationships, which need to be converted into activation and inactivation curves. These are fitted to the Boltzmann function and from the parameters of the fit the “window current” is finally reconstructed. This analysis is both routine and very time consuming. If performed manually, it would require 20-25 min per record even for an experienced user of Clampfit and Origin. Since Origin can import pClamp files directly and has built-in programmability combined with superior graphics, it became our software of choice for automation of data analysis.
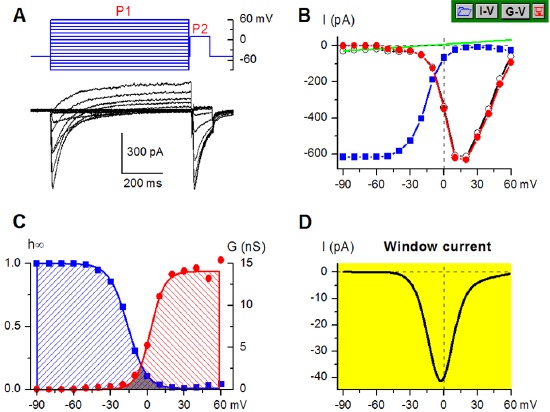
In this project, all above steps are programmed using the Origin LabTalkTM scripting language. The first three buttons at the top right of the graph initiate Origin pClamp data import with additional customised creation of the voltage protocol from values stored in the Axon file header (panel A, top), measurements of I-V relationships from specified epochs and linear leak correction (panel B, both raw and corrected data are plotted), construction of inactivation and activation curves and their fit to the Boltzmann function (panel C, blue and red lines, respectively) and calculations of the “window current” (panel D). The last button creates the worksheet where all fit parameters are stored.
Choosing the data file and selecting epochs for measurements is the only input required from the user. Thus, complete data analysis and plotting takes less than 30 s, allowing error-free analysis in less than 2% of the time that would take to analyse the data manually.
The graph was prepared using Origin 7.5 by Alexander Zholos (a.zholos@qub.ac.uk), Professor of Vascular Biology at Queen’s University Belfast, UK. He has long-standing research interests in ion channels controlling cellular excitation and calcium homeostasis. Additional graphs made in Origin can be seen in the following publications:
Otsuguro Ki, Tang J, Tang Y, Xiao R, Freichel M, Tsvilovskyy V, Ito S, Flockerzi V, Zhu MX and Zholos AV.
Isoform-specific inhibition of TRPC4 channel by phosphatidylinositol 4,5-bisphosphate. J Biol Chem
283: 10026-10036, 2008.
Zholos AV, Zholos AA and Bolton TB. G-protein-gated TRP-like cationic channel activated by muscarinic
receptors: effect of potential on single-channel gating. The Journal of General Physiology 123: 581-598,
2004.
Zholos A, Beck B, Sydorenko V, Lemonnier L, Bordat P, Prevarskaya N and Skryma R. Ca2+- and
volume-sensitive chloride currents are differentially regulated by agonists and store-operated Ca2+
entry. The Journal of General Physiology 125: 197-211, 2005.
http://www.qub.ac.uk/research-centres/CentreforVisionandVascularScience/Staff/ProfAlexZholos/