Simplified Molecular-Input Line-Entry Specification (SMILES) is a text-based protocol for drawing structural formulae of molecules. Data in the SMILES format allows many chemical structures to be stored using much less disk-space than storing images of the molecular structures. Using conversion code, the molecular line drawings can be reconstructed as needed.
A chemist and Origin user at a leading global health care company wanted to incorporate SMILES data into an Origin project, along with other physical properties of various compounds. The project would lend itself to the graphing of physical properties of molecules alongside their chemical structures. To achieve this, Origin programmers utilized a third-party DLL (Indigo, GGA Software) and additional Origin C code to convert the SMILES data to images of the chemical structures. The images were stored on disk and links to images were inserted into the data worksheet in a new column, for viewing. In addition, a custom toolbar button was built to enable quick access to the conversion function.
Brought together, the custom solution allowed this Origin user to interpret SMILE strings in Origin with the push of a button. The customer then created graphs of various quantities, and used Origin's Data Info tool to view related information, including the molecular images, when exploring the graph using the Data Reader tool.
|
|
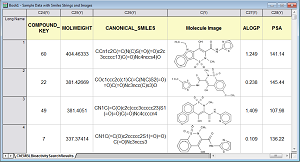
Origin worksheet displaying molecular images created from SMILES strings.
|
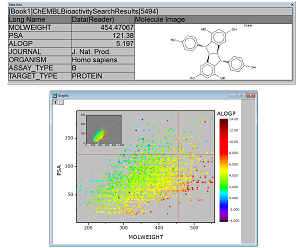
Top figure: Data Info display window can be configured to show desired quantities, including images. The display updates dynamically as user moves Data Reader cursor on the graph.
Bottom figure: Graph displays scatter plot of data from two columns, with symbol color assigned using color map of values from a third column.
|
| |
Top figure: Data Info display window can be configured to show desired quantities, including images. The display updates dynamically as user moves Data Reader cursor on the graph.
Bottom figure: Graph displays scatter plot of data from two columns, with symbol color assigned using color map of values from a third column.
|