Researching Effects of ATX Inhibition on Breast Cancer
|
"One of the nice things about Origin is how presentation of graphs is so customizable and hands on..."
Even as an undergrad Matthew Benesch, now an MD/PhD candidate at University of Alberta, had an illustrious career as a researcher with collaborations on numerous publications. During his work in the Biochemistry Department at University of Alberta, the Research Associate at his laboratory, Ruthven Lewis, introduced him to Origin. Ruthven Lewis, a long time Origin user and tester, was well versed in Origin’s myriad of features and also wrote custom Labtalk scripts and OriginC functions in support of baseline correction, curve-fitting and other utility gadgets. Benesch quickly found that Origin was an advanced data analysis software that, along with all the necessary tools, came with an economical pricing for an undergraduate. Additionally he found it flexible for his needs; for example as a Mac-user Benesch worked on Origin via a virtual machine. His experience with the virtual environment was seamless and he found the usability on par with working on Origin in a native Windows environment.
In his latest research focusing on drug development for cancer treatment, Benesch and his team investigated autotaxin (ATX), a secreted enzyme that promotes the circulation of certain lipids that increase the aggressive nature of cancer cells. The research honed in on breast cancer in particular since breast cancers cells cause normal cells to accelerate the production of ATX. Using ONO-8430506 as an ATX-inhibitor, the research used both in vivo and in vitro models to determine the efficacy of the inhibitor on tumors and cancer cells in mice. The team used spectroscopy to investigate the enzymatic activity on this harvested biological matter. The results were output to Excel from where they could be imported or copy pasted into Origin with the formatting and decimal places preserved.
| |
| Organization Signal Transduction Research Group
Department of Biochemistry
University of Alberta
|
| Problem Researching the effect of ATX enzyme inhibitors on breast cancer cells in vitro and in vivo, analyzing the results statistically and illustrating the findings graphically
|
| Solution Matthew Benesch and his team used Origin’s statistical and graphing features to visually represent the findings of their study on the efficacy of enzyme inhibitor in cancer therapy.
| | Key Features
|
|
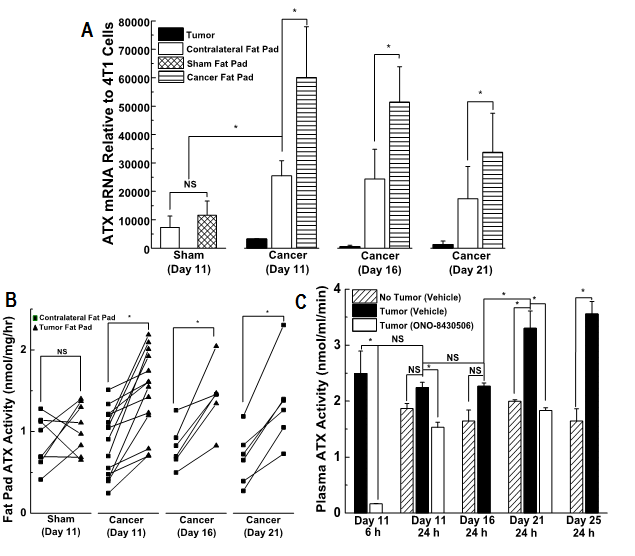
Figure 1. A multi layer plot with bar charts (A & C), 2 point segment plot (B), all featuring significance asterisk brackets
Once the data was in Origin Benesch tested for significance with the two tailed student t-test as well as one way ANOVA tests. He then portrayed the results using various Origin templates: scatter, bar, error bar etc. In Origin 8.1, he used multiple layers to create grouped scatter plots that represented the weights of tumor samples with and without the ATX inhibitor (Fig 2B); similar jitter plots can now be created in Origin 9.1 by modifying box plots. Additionally Benesch added significance asterisk brackets using the Line feature and the Symbol Map feature (Fig 2B). This can also now be done more simply by using the Add Asterisk Bracket button in version 9.1.
A combination of grouping and 2 point segment plot worked admirably for illustrating the ATX level relationship between tumor fat pads and unaffected fats pads in the surround areas. (Figure 1B)
Benesch appreciated the option to create multi layer graphs using data from different workbooks such as in Figure 1. Along with paneled graphs (Figure 1), the multi layer option also allowed him to create inset graphs to emphasize certain portions of his data while still providing readers with the larger picture as in Figure 2A.
Benesch says “One of the nice things about Origin is how presentation of graphs is so customizable and hands on. For example in order to arrange graphs, I can simply select them and drag the graph layer on the page, or simply select and drag the edges to resize the layer.”
In future Benesch hopes to be a part of many more exciting research endeavors concerning the development of breast cancer drugs, and he plans to continue using Origin for its superior user friendly options, advanced graphing and analysis features and cost effective pricing.
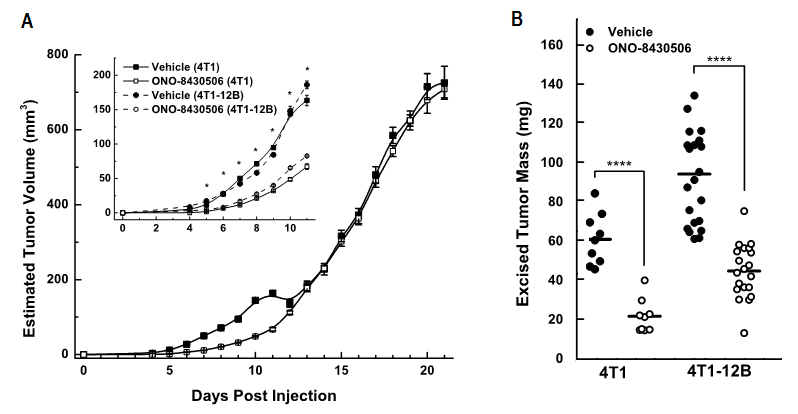
Figure 2. Inset graphs emphasize the beginning portion of the graph on the left (A) and a grouped scatter plot shows the affect of ATX inhibitors on tumor weight on the right (B)
**Benesch, Matthew G. K., Xiaoyun Tang, Tatsuo Maeda, Akira Ohhata, Yuan Y. Zhao, Bernard P. C. Kok, Jay Dewald, Mary Hitt, Jonathan M. Curtis, Todd P. W. McMullen, and David N. Brindley. "Inhibition of Autotaxin Delays Breast Tumor Growth and Lung Metastasis in Mice." The FASEB Journal - Research Communication 28.June (2014): 2655-666. Print.