With the ability to import many third-party data files, LabVIEW connectivity, flexible multi-layer graphing, intuitive tools for exploring and analyzing graphical data, batch analysis, and custom report capability, Origin is an ideal platform for Test and Measurement.
Custom Third-Party Import Formats
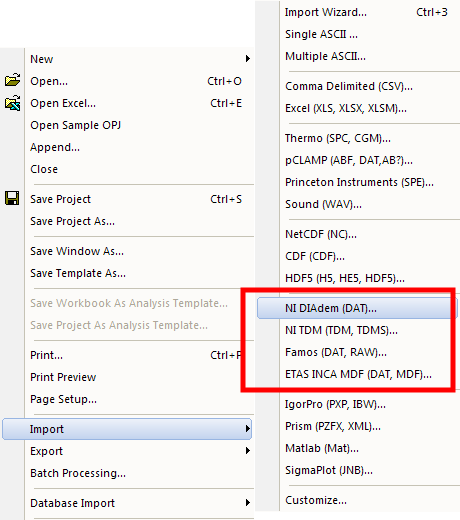
Origin provides custom import dialogs for third party data formats including: NI DIAdem, NI TDM, FAMOS, ETAS, CDF, and HDF. Each format has a custom import dialog, providing the following functionality:
- Import multiple files into separate books, sheets, or columns
- View and select channels/variables to be imported
- Add custom column headers with metadata information for each channel
- Re-import file to update on data change
- Turn on Sparklines to quickly view a profile of your datasets
- Save customized import settings as a theme file for repeat use
Origin also supports importing from a database, with a graphical interface for building queries, and an SQL editor. Once a query has been set up, it can be saved with the workbook, allowing for updating of the data at any time.
Origin provides a collection of LabVIEW sub-VIs that can be simply incorporated into your main LabVIEW application to seamlessly communicate with Origin.
The sub-VIs allow you to perform operations such as launching Origin, sending data to workbooks and matrices, sending commands to Origin to process the data, and then save the data and results as an Origin Project file.
Combined with the Analysis Template capability, you can push data from your LabVIEW application and have Origin automatically process, update, and save results, ready for later review and publishing.
Origin provides many data management tools to organize your work:
- 64-bit support introduced in version 8.6, allows you to work with very large datasets
- The Origin Project (OPJ) file allows you to organize your raw data, results and reports using a flexible, hierarchical folder structure
- Meta data created during import is saved with the worksheets, matrices and data columns, and is accessible at any time to select desired data, and for annotation of graphs
- The Plot Setup dialog for creating a graph allows you to access data from any worksheet or matrix anywhere in your project file. You can also sort available data based on metadata properties, and select and plot multiple datasets
- Once a graph has been created, the Layer Contents dialog allows you to easily replace or add data plots. Data can be added from any worksheet or matrix, and data can be sorted based on metadata properties
Multi-layer and Multi-axes Graphs
Origin ships with over 100 graph templates for you to easily create graphs from your data, including many templates for multi-axis and multi-panel graphs. Origin graphs allow flexible placement and sizing of multiple layers on the page, including the ability to link axes between layers.
Graphs can be easily customized by double-clicking on any element to change its properties. You can save your customization as a template or a theme for repeat use.
Graphs can be annotated with meta data created during import. Support is also available for embedding other OLE objects such as equations.
Export your graphs to a wide variety of vector or raster formats, or embed them in worksheets along with data and results to create custom reports.
Easy-to-use Tools for Data Exploration and Analysis
Origin provides many data tools for graphical data exploration and analysis, including:
- Screen Reader and Data Reader tools to view X, Y from your data plots
- Vertical Cursor gadget reads X, Y values from multiple curves in multiple layers, such as a stack plot with shared X axis
- Data Info window displays related information from many other columns associated with the graphed data
- Keyboard and mouse access to quickly zoom and pan inside a graph layer either in X or Y direction that are all linked layers will automatically follow zoom and pan changes to any single layer
- A wide selection of Gadgets for graphical analysis of data, including FFT, Linear Regression, Peak Analysis, and Rise Time analysis
- Advanced data analysis tools including the ability to customize and save dialog settings as a theme for repeat use on similar data
Custom Reports and Batch Analysis
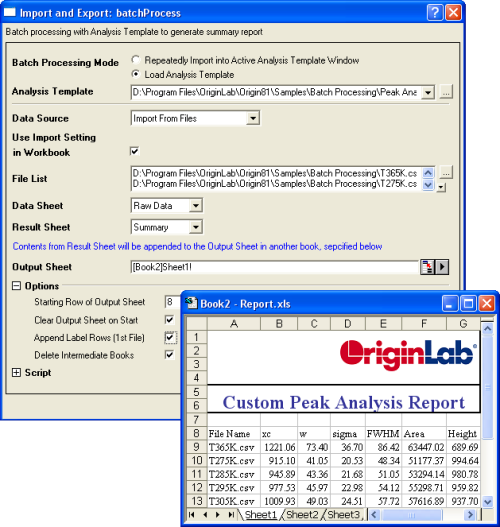
Origin provides a Batch Processing tool for performing repeat analysis on similar data files or datasets:
- Import one of your files, saving desired import settings to the worksheet
- Create graphs and embed them into worksheets to keep graphs in same workbook as data
- Perform data analysis and have the result sheets and analysis reports saved in same workbook
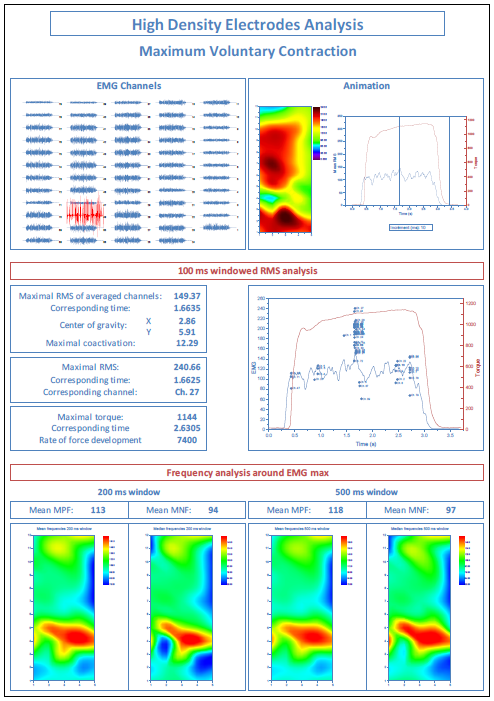
- Add optional Custom Report sheet to present data, graphs, and analysis results arranged flexibly
- Add a summary sheet to specify what parameters, including metadata and analysis parameters, you want summarized for each data file
- Save the workbook as an Analysis Template
- Use the Analysis Template for manually processing a single data file, or perform Batch Processing of multiple data files or multiple datasets in your project using the saved Analysis Template
The Batch Processing tool will create a summary report with one row for each data file or dataset that was analyzed. You have the option to keep all intermediate results from each data file or dataset as well.