Origin Used in Ecology Field
Problem
Research work activities relating to the riparian zones of the Three Gorges Dam Reservoir, China.
Solution
Muhammad Arif used Origin’s graphing and data analysis features to visually represent the findings of their study on the riparian zones of various water sources flowing into the Three Gorges Dam Reservoir (TGDR), China.
"Origin Pro 2021 has very impressive features that can help me to display my results in unique and interesting ways that can attract the editors and reviewers through its exceptional graphing.”
Muhammad Arif, a postdoctoral researcher in the Southwest University in Chongqing, China, mostly deals with research work activities relating to the riparian zones of the Three Gorges Dam Reservoir, China.
His study focuses on the riparian zones of various water sources flowing into the Three Gorges Dam Reservoir (TGDR), China. In his study, he will :
- Evaluate ecological parameters (in terms of riparian health and stress) based on stream channels (e.g., the main waterway and multiple tributaries);
- Categorize the key parameters responsible for the total variation between the structures of riparian zones across spatial scales (i.e., a massive area) and temporal scales (i.e., all seasons) in the TGDR;
- Explore the correlation between these ecological parameters with buffer and stream channel widths, which altered the response of the riparian zone in the shape of the landscape structure; and
- Assess the statistical similarities between ecological parameter indexes and sub-indexes with the varying degree of streams inside the TGDR.
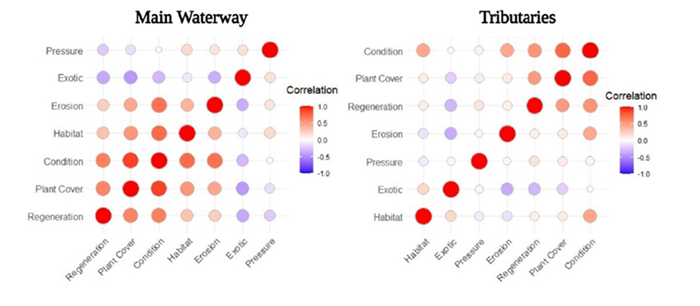
Figure 2: Heat maps of Pearson's correlation of habitat, plant cover, regeneration, erosion, exotic, condition, and pressure indexing/sub-indexing for the riparian zones in the Three Gorges Dam Reservoir, China. The correlation strength of each indexing/sub-indexing of the main waterway is shown in the first map, and tributaries are shown in the second map.The larger circle size shows a strong relationship, and the smaller circle size represents a weak relationship. Created with the Correlation Plot App with OriginPro 2021. (below).
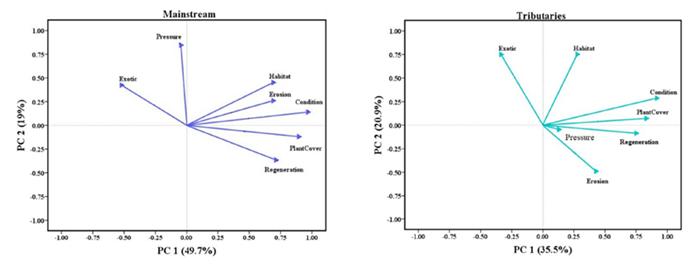
Figure 3: Principal component analysis (PCA) plots of habitat, plant cover, regeneration, erosion, exotic, condition, and pressure indexing/sub-indexing of the riparian zones of the main waterway(n =137)and tributaries (n =167) of theThree Gorges Dam Reservoir, China.The factor loading of PCA axes 1 and 2 of the main waterway is shown in the first plot and explained 68.7% of the total variation, whereas tributaries are shown in the second plot and explained 56.4% of the total variation. Analysis and graph created with Principal Component Analysis tool in OriginPro 2021.(below).
In the future, Muhammad will continue establishing statistical models and theoretical studies, which can generate technical information to combat the pressure effects of different land uses in various riparian zones of mega-dams. He believes OriginPro's comprehensive features can help him to display his research results to audiences by publishing in top indexing journals.