|
"Essentially, Origin allowed us to reconstruct the same functionality of the expensive proprietary software for a fraction of the cost."
Professor Bonizzoni, an assistant professor in the Chemistry Department of The University of Alabama, is involved in the investigation of supramolecular chemistry, the study of interaction forces between artificial molecular systems, particularly in water solutions.
When Professor Bonizzoni’s most recent research required fitting complex experimental data, he found that Origin’s non-linear curve fitting feature outperformed other softwares and suited his purpose admirably. Here he talks more about his discovery and use of Origin:
We used Origin for its advanced non linear fitting capabilities. In our group we use a number of optical spectroscopy techniques to investigate non-covalent binding in supramolecular contexts. As a consequence, we do a lot of data plotting and line fitting. So far, we have been using a combination of third party software packages for spreadsheet calculations, advanced plotting and advanced non linear fitting.
We have recently acquired a time-resolved fluorescence spectrometer to determine emission lifetimes of fluorescent molecules involved in our studies. Determination of the lifetimes requires the fitting of a multi-exponential decay expression to each experimental curve. A complete experimental data set comprises ten to twenty such curves, each containing a few thousand data points. Some fitting parameters are shared among these curves, so a global fitting routine is required. In addition to the sheer size of the data sets, the fitting problem is furthermore complicated by the need to carry out a so called "deconvolution fitting" to separate experimental features from the instrumental response superimposed onto it.
The instrument manufacturer offers a single-purpose software capable of carrying out such fits, but its price was prohibitive, so we first attempted to use other commonly used analytical softwares to write our own in-house fitting routines, with very little success.
The key issue in this context was the fact that, in order to do the data deconvolution, we would need low-level access to the data as it is being processed by the non linear curve fitting routines. As far as we know, the software we were initially using doesn't offer this feature. The problem might have been solved with a more advanced software, but at the cost of writing our own fitting routines, with the associated steep learning curve and waste of time as we go about re-inventing the wheel.
Origin was able to tackle this crucial issue out of the box. Within a few hours of installing a demo version of the software, we had a viable global fitting routine up and running. The key feature for us was the ability to access data from the innards of the fitting routine as it was being processed (through the NLSFCURRINFO method), so that it was easy to write a subroutine that would extract the raw data from the fitting routine, apply the appropriate deconvolution algorithm, and feed the data back into the main fitting routine for the next iteration. We even found such a code snippets in the Origin on-line help and support groups that we could easily modify to fit our needs. We are very satisfied with our current results, and we are now working to integrate that into a general global fitting routine. Essentially, Origin allowed us to reconstruct the same functionality of the expensive proprietary software for a fraction of the cost.
|
|
| Organization Department of Chemistry University of Alabama |
|
Problem
Finding a cost-effective software that could do multi-exponential user defined global fits with shared parameters on large data sets.
|
|
Solution Used Origin's advanced NLFit feature to set up a global fitting routine using their own user defined function. Used the NLSFCURRINFO method to access data during the fitting process, deconvolute it, and insert it back into the fitting process.
|
|
Key Features
|
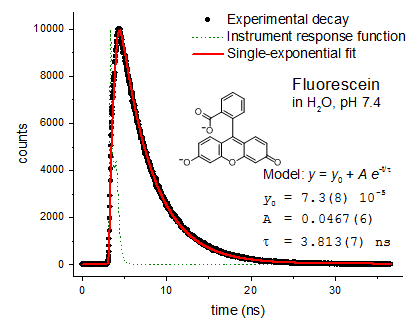
Figure 1. This is an example application of this method to the determination of the fluorescence lifetime of fluorescein, a common organic dye. The decay is known to follow a single-exponential law in the selected experimental conditions, but the actual signal measured (filled black dots) is convoluted with a complex instrument response function (IRF, green dashed line). The decay curve was fit to a single exponential model by deconvolution of the IRF as described above. The lifetime parameter τ we recovered from this fit is in excellent agreement with literature values.
|