Origin in Studies of Placental Development During Human Pregnancy
Problem
Fisher Lab works to identify factors that cause diseases of pregnancy, such as preeclampsia. Their work may generate large datasets consisting of tens of thousands of measurements. Such large datasets require rapid, powerful analytical and visualization tools.
Solution
Origin's point-and-click interface provides access to powerful analysis and graphing routines such as Two-way Repeated Measures ANOVA and Trellis plots, tools which are typically available only to those with programming capability.
“Origin enables rapid, powerful data analysis and visualization. It has features that are usually associated with a command-line, such as Bioconductor packages in R.”
During human pregnancy, a rapidly developing embryo attaches to the inside of the mother's body and feeds, via the mother's blood, for approximately nine months. In the initial stages of development, the embryo must quickly attach to the uterus to gain access to the mother's circulatory system. Implantation of the embryo occurs when trophoblast cells of the embryo invade the uterine wall. If the invasion is shallow, blood flow is restricted and the mother and fetus risk developing the serious and potentially fatal condition preeclampsia. In preeclampsia, the mother experiences an unhealthy rise in blood pressure that in the worst cases may trigger seizures and result in the death of the mother and child.
Matthew Gormley is a scientist in Susan Fisher's lab at the Center for Reproductive Sciences at the University of California, San Francisco (UCSF). The mechanisms by which human placental cells invade the uterus during pregnancy are a primary focus of Fisher Lab's research. Gormley studies trophoblasts, the specialized cells out of which the placenta is formed. The group is looking for ways to detect or prevent diseases of pregnancy like preeclampsia by comparing the activities of trophoblasts from normal pregnancies, with those in which symptoms of preeclampsia were observed.
“We are just beginning to grasp the power and flexibility of trellis displays.”
Gormley finds Origin's Trellis Plot -- new in Origin 2017 -- to be a powerful tool for visualization and analysis. "We are just beginning to grasp the power and flexibility of trellis displays. Trellis plots can be used an infinite number of ways, since a trellis panel can be made to represent anything--objects, locations, ideas. For example, DNA is naturally organized into discrete structures -- chromosomes -- and the chromosome location of nearly all genes is well known. Measurements of gene expression displayed as a chromosome trellis presents a genome-wide map highlighting foci of differential expression."
Asked to describe a recent project on which his group used the trellis plot, Gormley related the following: "Using a microscopic computer-guided laser, we captured precise portions of normal and diseased organs. We identified and measured their RNA, much like reading a cookbook of baking recipes. Our book, detailing three cell types from two conditions repeated four times with tens of thousands of measurements each, was huge. Using Origin's Two-way Repeated Measures ANOVA, we identified the RNA classes that significantly associate with preeclampsia.
Extending his "baking" analogy, Gormley adds that researchers tested the data for enrichment of specific biological processes and compared the process to "flipping through a cookbook to see which recipes can be made with the ingredients on hand."
"The challenge is to simultaneously display the amount of every ingredient of every possible recipe from six different kitchens, half of which are burning. Potentially overwhelming data can be tamed with a trellis plot. We used Origin to create a trellis displaying the expression of genes coding the processes occurring within normal and diseased tissues (for a published example of this type of Trellis Plot, see Preeclampsia: novel insights from global RNA profiling of trophoblast subpopulations, American Journal of Obstetrics & Gynecology)."
Since Gormley's group has considerable experience with large biological datasets and with summarizing that data using trellis plots, we asked Gormley if he had any tips for other Origin users who might be struggling with the best way to summarize similar data:
"The easiest way to make trellis displays is to use unpivoted data. Consider a simple 2 X 2 table. By organizing information into rows and columns, pivot tables logically compress data. Trellising presents a whole new way to logically compress data. By utilizing the inherent structure of a regular lattice, trellis displays are a compact, highly organized arrangement of comparators. Though pivoted tables can be used, constructing a trellis with decompiled information truly brings out the power and flexibility of the lattice.
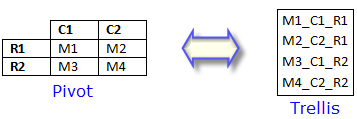
"The pivot table above can be decompiled to four lines of data. This data array can be imported into an Origin workbook composed of four rows and three columns (4 X 3). Each column now describes the comparisons -- the pivots -- in the original table. So, by unpivoting tables to include descriptions of the comparisons that they contain, information can easily be trellised. By choosing which values to use for M, C and R, many different, exciting trellis plots can be created.
Gormley generously created and shared the two accompanying trellis plots just for the purposes of this case study. He explains that in the "exon strand mapping graph (above), our DNA is organized into 23 sets (numbered across the top). DNA is double stranded, indicated by the "+" and "-" strands. There are two important conclusions that can be derived from this display. First, the height of each column conveys the contribution of each chromosome. Chromosomes 1 and 2 are physically the largest, so we expect a greater contribution. Chromosomes 21 and 22 are the smallest, so we would expect a smaller contribution. The real surprise here are the large contribution from the "X" chromosome (which, among many others, contains the genes that control sex determination). The second conclusion is the sheer number of positions that show activity on both strands of DNA. Normally, we would NOT expect this. These results would bear true in a more in-depth, time consuming analysis. The trellis plot unveiled this immediately."
Regarding the trellis plot of exon position fold change (right), Gormley says "the chromosomes are now arranged vertically. As we walk from left to right across the length of each chromosome, I show the relative expression of the active gene segments for each cell type. One could spend hours harvesting information from this plot. We can quickly identify 'hotspots' on each chromosome, active genes in surprisingly close proximity, suggesting a common regulator for the grouping. I highlighted one region as an inset."
Gormley tells us, however, that Origin had been an integral part of Fisher Lab's work long before trellis plots were added to the software. "I began using Origin soon after joining our group over a decade ago. Our mass spectrometry experts were already using Origin to visualize their salivary proteome discoveries. I first used Origin to demonstrate parallel results between orthogonal quantification techniques."
Asked about other aspects of Origin he most appreciates Gormley points to Origin's powerful point-and-click analysis tools plus the ability to handle large datasets. "Origin enables rapid, powerful data analysis and visualization. It has features that are usually associated with a command-line, such as Bioconductor packages in R. Origin can be driven by a mouse, which is far easier than typing out lines of commands. Origin can handle big data spreadsheets that crash Excel. The significance of experimental results can be tested using standard and nonparametric statistics. Robust analyses, such as repeat-measure two-way ANOVA, are point-and-shoot."