Using Origin to Investigate the Brain Mechanisms that Regulate Eating Activity
Problem
Study the neural mechanisms that regulate swallowing and masticatory activity, and masticatory muscle activity during sleep.
Solution
Import pCLAMP data, then plot as a panel graph, with up to 90 different plots arrayed side-by side.
The following case study was submitted by Japanese Origin distributor LightStone Corporation. Lightstone has provided sales and support for the Japanese-language version of Origin, for nearly twenty years. We thank them kindly for giving permission to publish this case study on our website.
“When I attended the Society for Neuroscience in North America, I asked an exhibitor for recommendations for a good software package to analyze wave data, and they recommended Origin.”
Introduction
For humans and animals, efficient digestion is helped by thorough mastication of food before swallowing. While people may eat by giving careful attention to chewing, accidental biting of the tongue or inner cheek is relatively rare, even when attention is not being paid. Further, when healthy people ingest food and swallow, the food seldom mistakenly enters the windpipe. People are capable of unconscious and proper regulation of the actions of masticating and swallowing.
Here, at the Department of Oral Physiology of the Showa University School of Dentistry, in Japan, in an effort to study the brain mechanisms that regulate swallowing and masticatory activity, and masticatory muscle activity during sleep, we have undertaken various studies using the latest equipment such as a two-photon excitation microscope, an optical recording system, patch-clamp devices, etc., and analyzing nerve activity in perfusing animals and masticatory muscle activity in freely moving mice.
Convenient Comparison of Waves such as of Electrical Activity
L (LightStone): How did you start using Origin for your research?
I (Prof. Inoue): When I attended the Society for Neuroscience in North America, I asked an exhibitor for recommendations for a good software package to analyze wave data, and they recommended Origin.
“It is crucial for our purpose to be able to extract the proper range of the data from many waves, and to be able to flexibly arrange the curves to compare among them easily. This is the reason we chose Origin.”
L: Origin can import the pCLAMP data directly. Was this feature the reason for that recommendation?
I: Although it was one of the reasons, it was not essential because the data can be output from our equipment in an ASCII format. Of course, it helps to reduce the number of steps for tasks. In our lab, we record the electrical activity in the brain or the muscle. To evaluate the effect of the operation in the experiment, we compare the set of wave plots which were recorded prior to, during, and subsequent to the operation. That is, it is crucial for our purpose to be able to extract the proper range of the data from many waves, and to be able to flexibly arrange the curves to compare among them easily. This is the reason we chose Origin.
L: How about after having Origin in your lab?
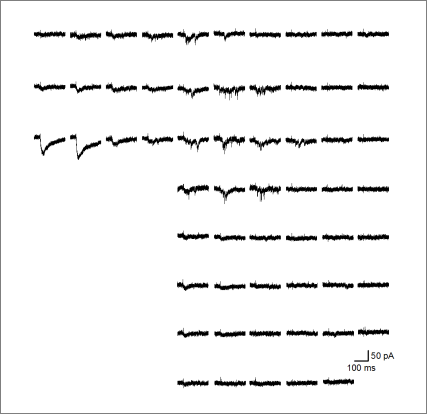
I: The biggest advantage of Origin is the ease with which you can stack an ordered series of wave plots. In our case, we occasionally create as many as 80 to 90 layers in a single graph, and in Origin we can set all horizontal and vertical axes throughout the graph to the same scale in a single operation. It is very convenient because we don’t have to rescale every layer’s plot one by one. Also, when we submit our research paper to a journal, the referee sometimes asks that we conduct extra experiments to obtain new wave data. Then, we must replace the figures in the paper with new figures. In Origin, it can be conveniently and quickly done by simply updating the reference to the data worksheet, with perhaps a rescaling of the plot.
Producing Publication-Ready Graphs
L: I see. One of the big advantages of Origin for you is that the user can create a new graph with the same format as the original by simply changing the worksheet reference.
I: It is also advantageous that in Origin the user can create and finalize the graph using the same process, from the original data to the finalized graph for publication. Although there may be occasions when we use other graphic editing software for the final touch, typically using Origin is, by itself, sufficient to make and combine wave plots efficiently into a single graph. It is really convenient to be able to use a single package that begins with data and ends with a publication-quality graph. In contrast to the easy replacement of the wave plots when using Origin, it is our experience that if we used more than one software package to create a graph, replacing a plot with a new data plot would surely be a quite cumbersome task.
“ It is really convenient to be able to use a single package that begins with data and ends with a publication-quality graph.”
L: According to our customer records, you, Prof. Inoue first purchased an Origin license in 1995. That was Origin version 5.0. As a seasoned user of Origin, could you please give any advice to new Origin users?
I: It is analogous to playing golf – in the beginning, it may take a little bit time to hit the ball to propel it straight forward. But you can eventually overcome your lack of skill by practicing patiently. People who need to compose plots for side-by-side comparison, as we do with our wave data, will certainly find it of great value.
Requests for Future Versions of Origin
Editor's note: Download an OPJ file with instructions for making this graph, from OriginLab's Graph Gallery.
L: Do you have any thoughts for features or services you would like to see added to Origin?
I: I would like to see Origin become capable of effectively extracting the action potential waves. That is, we often measure the number or frequency of action potentials which are produced by stimulation currents with various strengths, to a neuron. When a spike-like wave is found in the trace, it may indicate an action potential. If a peak value and the duration fit within certain ranges, we would like to look closer at it to determine if it is an action potential.
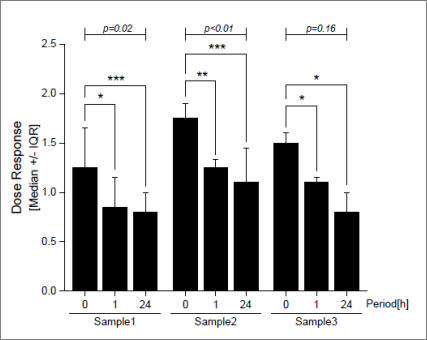
In addition, when a bar chart has a pair of bars which can be statistically judged as significantly different, we want to put connecting line segments to show their difference. To do this, we either compose and put additional three line plots into the bar graph; or add three line objects using the Line Tool. In the former case, we can keep the connecting shape even after rescaling the parent graph, but making three plots is a tedious task. In the latter case, once the original bar chart is rescaled, the positions of the attached line objects would be broken. I hope this task would become easier in future.
L: Regarding peak analysis, Origin provides a peak analysis tool, called Peak Analyzer. This tool has various functions for peak analysis such as peak finding, etc. So, please try to use it to see how much it helps your work. Regarding the line segments in a bar chart to show the statistical difference, a handy tool, called Asterisk Bracket, which can draw such bracket shape object by one-click operation, has become available since Origin 9.1. This feature has been developed based on the requests from Japan.
“ Every time some inconvenient or difficult situation has arisen when working in Origin, the Origin support team has done really a good job to resolve the issue ... it is not common to have such good user support in the software industry.”
I: Oh, that is good. Users’ requests have been taken into the Origin products.
L: How do you feel about the user support of Origin?
I: Every time some inconvenient or difficult situation has arisen when working in Origin, the Origin support team has done really a good job to resolve the issue, and I am grateful as our research was able to proceed without interruption. As you know, it is not common to have such good user support in the software industry.
L: Thank you very much for sharing with us, your valuable experiences and opinions.