Global Nonlinear Curve - Fitting Using Origin
by Dylan Bulseco, Ph.D.
Introduction
Nonlinear curve fitting is an essential tool for analyzing biological, pharmacological, physiological and biochemical data (Johnson, 1992). The primary objective is to use specific mathematical approaches to fit a relevant model to the experimental data. The result of this analysis is best-fit estimates for variables in the model that represent meaningful scientific parameters. Many software packages implement these mathematical approaches enabling researchers to utilize nonlinear curve fitting to analyze their experimental data.
Global analysis of data takes this approach one step further. This ‘global’ approach refers to the simultaneous analysis of multiple experiments with any combination of shared and unique parameters (Beechem, 1992). For example, experiments may be conducted under different conditions or on material with different values for one or more of the variables in the model equation. Global analysis enables researchers to fit all of these experiments together, using shared and unique parameters in the fit, to obtain values that are meaningful for the experiment being conducted.
Background
Many membrane receptors are expressed on cell surfaces in more than one affinity state. For example, G-protein coupled receptors have been reported to have two or three affinity states. The m2 muscarinic acetylcholine receptor expressed in Chinese hamster ovary cells was used to illustrate the utility of global nonlinear curve fitting approaches. Cells expressing this receptor were pre-treated with agonist (carbachol). The fraction of receptor in the high affinity binding state is reduced, although the binding affinity is unchanged. Experimental datasets were fit individually (control and pre-treated cells) and globally. The former approach fit each binding affinity (in this case, logIC1 and logIC2) and fraction (F1 and F2) individually, while the latter used both shared parameters (affinity) and unique parameters (fractions).
Model used in the nonlinear curve fitting
Data were fit in Origin using a two-site competition binding equation:

This logistic equation results in values for log IC50 for two affinity states (logIC1 and logIC2) as well as the fraction (F) of receptor in these states. Although the results of this analysis are regularly referred to as affinity (e.g. Ki or K1 and K2), the model being used actually provides estimates for log IC50 which can then be converted to affinity values using a relationship described by Cheng and Prusoff (1973). Global nonlinear curve fitting in Origin is easily implemented. When selecting the data to be fit, Origin gives users the opportunity to fit more than one data set. With a few clicks of the mouse, multiple sets of data can be selected and parameters marked to be shared or not. The rest of the fitting procedures are identical to fitting single data sets, and Origin automatically plots the fitted lines and provides parameter estimates with error values.
Results
Table I shows the results of the nonlinear curve fits when the control and treated cells were analyzed separately (Individual Fit). One does not expect the treatment to affect the binding affinity of the two states, but rather the fraction of receptor that exists in the two states. By this analysis, the high affinity states appear to be shifted after treatment, while the fraction of receptor in the higher affinity state remains the same.
The same data was fit using global nonlinear curve fitting and results in parameter estimates that make more sense biologically. Since the treatment is expected to reduce the fraction of receptor in the high affinity state, but not affect the actual affinities for the two states, the only unique parameter used in the fit was Fraction of receptor while the other parameters were shared. From this analysis, one observes that fraction of receptor is reduced from 0.36 to 0.11 after pre-treatment of the cells, a result that is biologically relevant. In addition, the logIC50’s obtained when fitting with shared parameters closely resemble the results when the control cells are analyzed alone.
Table I: Parameter Estimates for Nonlinear Curve Fitting
|
Individual Fita |
Global Fitb |
|
Control |
Treated |
Control |
Treated |
Max |
0.96 |
0.98 |
0.98 |
0.98 |
Min |
0.02 |
0.01 |
0.04 |
0.04 |
logIC501 |
-7.94 |
-6.58 |
-8.18 |
-8.18 |
logIC502 |
-5.48 |
-5.30 |
-5.72 |
-5.72 |
Fractionc |
0.39 |
0.42 |
0.36 |
.011 |
a All parameters were fit independently.
b All parameters (in italics) were shared. Fraction was fit independently for each data set.
c Fraction for lower affinity binding site (IC502) is obtained by 1-Fraction.
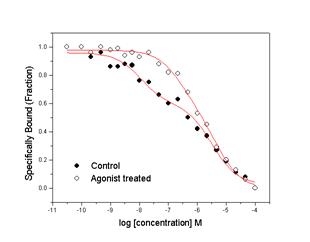
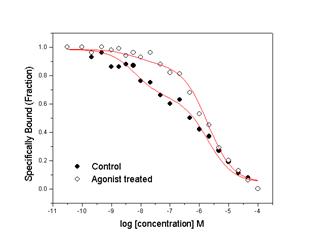
Finally, plots of the experimental data along with the fitted lines are presented above (Individual and Global Fits in the left and right panels respectively). One can see that it is impossible to determine which analysis is “correct” based on these plots. The fitted lines that result from these two analysis approaches are very similar although not identical.
Summary and Conclusions
Nonlinear curve fitting is a powerful tool for the analysis of pharmacological, biochemical and biological experimental data. Global nonlinear curve fitting approaches provide additional features and may enable researchers to observe trends in their data that might otherwise go unnoticed. It is important to consider physiological relevance for any mathematical model used to analyze experimental data, and global nonlinear curve fitting can offer users additional analysis approaches.
Note: This is a condensed version of an original paper that first appeared on the HMS Beagle web site (a BioMedNet publication).
References
Beechem, J. M. (1992). Global Analysis of Biochemical and Biophysical Data. Methods in Enzymology, 210: 37-54.
Cheng, Y. and Prusoff, W. H. (1973). Relationship between the inhibition constant (Ki) and the concentration of an inhibitor that causes a 50% inhibition (IC50) of an enzymatic reaction. Biochem. Pharmacol. 22, 3099-3108.
Johnson, M. L. (1992). Why, When and How Biochemists Should Use Least Squares. Analytical Biochemistry 206, 215-225.
About the Author
Dylan Bulseco is the Director of Assay Development at Sensor Technologies (www.fcsxpert.com)