Origin supports the analysis of pharmacologic data with multiple built-in features. Whether evaluating dose-response parameters, fitting a standard curve, or performing a global fit on multiple datasets, Origin helps make your analysis efficient and effective.
- Built-in Analysis Templates for dose-response analysis
- One-step fitting for standard and response curves
- Templates for producing a standard curve from assay data
- Global and replicate fitting of multiple datasets
- Customizable templates and Batch Processing tool for automating large-volume analysis
Dose-Response Analysis

A typical first step in dose-response (or concentration-response) analysis is to fit the measured response of a system to varied concentrations of an agonist, producing a control curve. An antagonist is introduced, response data is collected, and fitting is again performed. Comparing the two fit curves yields valuable information about the biochemical complexes involved in the relative response of the agonist in the presence of the antagonist. Origin's non-linear fitting tool, NLFit, makes analyses such as dose-response, which rely heavily on curve fitting, very straightforward. While many functional relationships are possible, the majority of dose-response curves are well fit with a sigmoidal curve. Origin provides many built-in fitting functions:
- Dose Response, Biphasic Dose Response
- Logistic, 5-parameter Logistic, Sigmoidal Logistic (type 1, 2 and 3)
- Hill, Modified Hill
- Boltzmann, Transformed Boltzmann, Double Boltzmann
- One Site Binding, One Site Competition
- Two Site Binding, Two Site Competition
- Michalis Menten
- Gompertz
- Richards (type 1 and 2)
- Weibull (type 1 and 2)
Standard Curves with Replicate Fitting
A standard curve provides the basis for determining unknown parameters from a well-defined fit of response data from a particular system. A typical standard curve is generated from multiple experiments with very similar sampling intervals and parameter values. Rather than averaging the data before fitting, which can introduce statistical bias, Origin's Replicate fitting option — Concatenate Fit — allows the raw datasets to be fit together, resulting in a better overall fit.
Origin can then interpolate the standard curve to find X-values (concentrations, i.e., EC20 or EC80) at given Y-values, and vice versa. Use the Assay template shipped with Origin, or design your own template to automate this feature.
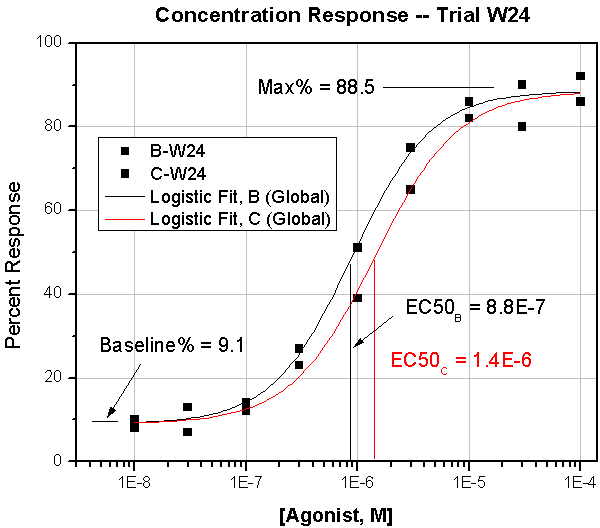
Global Fitting for Multiple Datasets
You may require that datasets be fit independently or together, utilizing a global fit and sharing parameters such as the baseline or maximum response asymptote. Origin allows individual and global fitting of multiple datasets, and allows you to easily add or remove data from the analysis.
Origin's global fitting capabilities for pharmacologic analysis are demonstrated in a Global Fitting Case Study.
Exploring Data with the Quick Sigmodal Fit Gadget
The Quick Sigmoidal Fit gadget uses nonlinear regression with a sigmoidal function to fit the active dataset. Similar with the Quick Fit gadget, it allows you to rapidly fit several curve types to a dataset to determine which is best. Likewise, use a similar fitting function for multiple datasets.
Both Quick Fit and Quick Sigmoidal Fit are extremely useful tools for exploring your data before doing a full analysis. When ready to move the analysis to the next step, the parameters and results can be sent straight to Origin's non-linear fitting tool (NLFit).
Weighted Fitting for Averaged Data
Sometimes response curve data is only available as averaged data with some associated error. Origin's different weighted fitting methods allow the error values (or other prescribed value) to factor into the fit.
Batch Analysis of Dose Response Data
Once an analysis has been performed, save it as an Analysis Template for repeated use; simply import new data into the template and the analysis will complete autmatically. For those with large amounts of data, use Origin's batch processing tool along with your Analysis Template to automate dose response analysis.