|
Dr. Leslie R. Bernstein and colleagues conduct research concerning binaural psychoacoustics – the study of how the ear and brain process interaural (across ear) differences in the physical waveforms arriving at the two ears. Binaural auditory function underlies the ability to localize sound in space and to understand conversation in noisy environments. Their work requires software that allows them to import, analyze and create publication-quality graphs of complex experimental data.
Origin was chosen because of the flexibility it offers in terms of being able to generate, modify, and customize plots easily and efficiently. One particular feature that has proved both essential and useful is the ability to use log-base-2 axes so that the independent variable can be plotted in terms of octave intervals. Figure 1 depicts such an example in which the effective repetition frequency of a sound is plotted on an octave scale.

Figure 1.
Another reason the software suits the laboratory’s data-analysis needs is that Origin allows rapid importing and plotting of large-scale data-sets. As an example, Figure 2 shows the results of importing multi-thousand-point time-waveform and accompanying spectral calculations for typical stimuli used in experiments conducted within the laboratory.
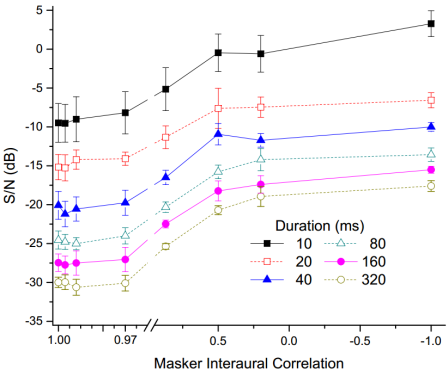
Figure 3.
| |
| Organization Department of Neuroscience and Surgery (Otolaryngology)
University of Connecticut Health Center
|
| Problem Import, plot and analyze complex data and create publication-quality graphs
|
| Solution Use Origin to import preliminary data for analysis and create graphs ready for publication
| Key Features
- Logarithmic scale
- Rapid import and analysis of multi thousand point waveforms
- Multiple panel graph representation
- Axis break
- Different scales before and after axis break
|
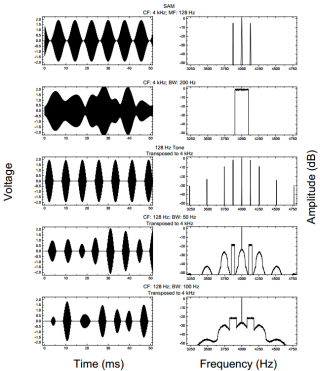
Figure 2.
The researchers also make use of the axis-break feature to plot the values of a variable with multiple scalings along a single axis. An example is shown for the variable “Masker Interaural Correlation” shown on the x-axis in Figure 3. As the figure reveals, Origin allows for the creation of an axis-break with different scales before and after the break so that the relevant portions of the data can be depicted. Additionally the newest version, Origin 9.1 now comes with a feature that allows multiple axis breaks.
|