2.84 FAQ-865 How do I exclude hidden data rows from my analysis and plotting operations?Exclude-hidden-filter-rows
Last Update: 7/14/2018
You can hide worksheet data rows by (a) selecting rows and clicking the Hide/Unhide Rows: Hide shortcut menu command or by (b) applying a data filter.
The Ignore Hidden Rows on Plotting and Analysis Checkbox
There is an Ignore Hidden Rows on Plotting and Analysis checkbox on the worksheet's Properties dialog box, Miscellaneous tab that is checked by default. When in this state, rows hidden using Hide/Unhide Rows or a data filter, will be skipped over in analysis and plotting operations.
Note that since this is a sheet-level setting, each sheet in a book can be set differently.
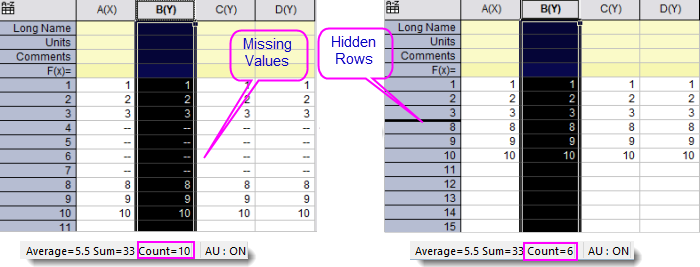
Hidden Values are NOT Missing Values
Note that hidden values are not treated the same as missing values. The worksheet on the left contains four rows of missing values; the worksheet on the right contains four rows of hidden values. The missing values are counted by the count() function while the hidden values are not counted.
The @GMH System Variable
The @GMH system variable controls whether to follow the Ignore Hidden Rows... check box setting in Worksheet Properties or the equivalent LabTalk wks.ignorehidden object property.
This LabTalk system variable was introduced in Origin 9.1 SR0, with a default value of 0. In Origin 2017 SR0, a new default value of -1 was added:
- -1 = (default) Follow the Ignore Hidden Rows on Plotting and Analysis check box setting. Note that each sheet in the book can have a different setting.
- 0 = Do not skip hidden rows in plotting and analysis. Overrides individual sheet settings.
- 1 = Skip hidden rows in plotting and analysis. Overrides individual sheet settings.
For information on the @GMH system variable see LabTalk: System Variable List.
Keywords:hidden rows,hidden columns, filter, plotting, analysis, ignore
|