2.61 FAQ-504 How do I reduce XY or XYZ dataset?Last Update: 10/13/2016
Reduce-XY-XYZ-Dataset
If you want to reduce duplicate X data contained in an XY dataset, highlight the Y column and select Analysis:Data Manipulation:Reduce Duplicated X Data. This dialog is based on the reducedup x-function.
If you want to remove duplicate XY data from an XYZ dataset, you could use the Statistics on Columns tool, and follow the steps listed below:
- Highlight the Z column, select Statistics:Descriptive Statistics:Statistics on Columns, this column will be used as the Data Range in the Input tab of Statistic on Columns dialog.
- Click the arrow button in Group control to select the X and Y columns as the grouping data.
- Go to the Quantities tab, expand the Quantities branch and choose which quantities you wish to replace duplicate values with (e.g., Minimum, Median, Maximum).
- If you also want to output the number of duplicate XY replaced, check the N total option under the Moments branch.
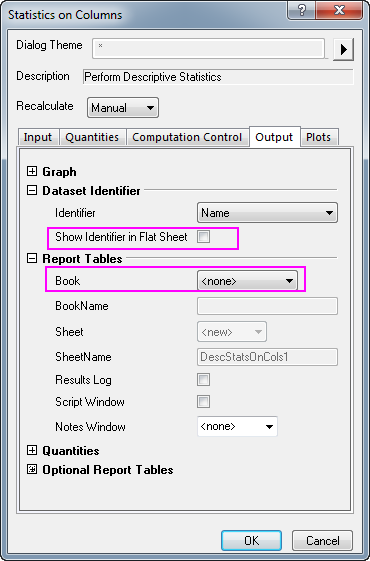
- Go to Output tab, under the Dataset Identifier branch, clear the check box after Show Identifier in Flat Sheet; under the Report Tables branch, choose None from the Book drop-down menu.
- Click OK. In the report sheet, the XYZ dataset will be reduced for duplicate XY.
| Notes: The Statistics on Columns method just described can also be used to remove duplicate XY for XYY data.
|
Keywords:data reduction, remove duplicate, duplicate rows, data manipulation, nested columns, statistics on columns, reduce X, reduce X and Y
|