4.2.2.25 Fitting with a Piecewise Linear FunctionFitting-Piecewise-Linear
Summary
In this tutorial we will show you how to define a piecewise fitting function consisting of two linear segments, perform a fit of the data using this fitting function, and calculate the intersection location for two linear segments from the fitting result.
Minimum Origin Version Required: Origin 8.6 SR0
What you will learn
This tutorial will show you how to:
- Define a piecewise (conditional) fitting function.
- Auto initialize parameters.
- Calculate the intersection location of the piecewise fit lines.
Example and Steps
Import Data
- Start with an empty workbook. Select Help: Open Folder: Sample Folder... to open the "Samples" folder. In this folder, open the Curve Fitting subfolder and find the file Step01.dat. Drag-and-drop this file into the empty worksheet to import it.
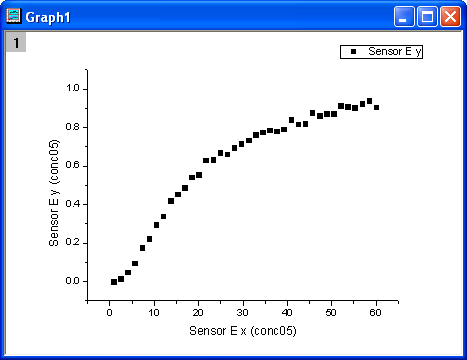
- Right click on the Sensor E x column (column J), and select Set As: X from the context menu. Highlight Sensor E y column, and select Plot: Symbol: Scatter from Origin menu. The graph should look like:
Define Fitting Function
From the above graph, the curve consists of two segments of lines. It can be fitted with a piecewise linear function. The function can be expressed as:
+y_3(x-x_1)}{x_3-x_1}, & \mbox{if } x<x_3 \\
\frac{y_3(x_2-x)+y_2(x-x_3)}{x_2-x_3}, & \mbox{if } x \ge x_3
\end{cases}")
where x1 and x2 are x values of the curve's endpoints and they are fixed during fitting, x3 is the x value at the intersection of two segments, and y1, y2, y3 are y values at  respectively. respectively.
The fitting function can be defined using the Fitting Function Builder tool.
- Select Tools: Fitting Function Builder from Origin menu.
- In the Fitting Function Builder dialog's Goal page, click Next button.
- In the Name and Type page, select User Defined from Select or create a Category drop-down list, type pwl2s in the Function Name field, and select Origin C in Function Type group. And click Next button.
- In the Variables and Parameters page, type x1,y1,x2,y2,x3,y3 in the Parameters field. Click Next button.
- In the Origin C Fitting Function page, click the
 button on the right of the Function Body edit box and define the fitting function in Code Builder as follows. button on the right of the Function Body edit box and define the fitting function in Code Builder as follows.
   if( x < x3 )
      y = (y1*(x3-x)+y3*(x-x1))/(x3-x1);
   else
      y = (y3*(x2-x)+y2*(x-x3))/(x2-x3);
Click Compile button to compile the function body. Then click Return to Dialog button. Click Next button.
- In the Parameter Initialization Code page, click the button on the right of the Initialization Code edit box and initialize the fitting parameters in Code Builder as follows.
   int n1, n2, n3;

   x_data.GetMinMax( x1, x2, &n1, &n2 );
   x3 = x1 + (x2 - x1)/2;

   y1 = y_data[n1];
   y2 = y_data[n2];

   vector vd;
   vd = abs( x_data - x3 );
   double xta, xtb;
   vd.GetMinMax( xta, xtb, &n3 );
   y3 = y_data[n3];
Click Compile button to compile it. Then click Return to Dialog button. Click Finish button.
Define Derived Parameters for Slopes and Intercepts
During function defined process, you can also define some additional derived Parameters such as slopes and intercepts , which are computed from the function parameter values after the fitting process ends.
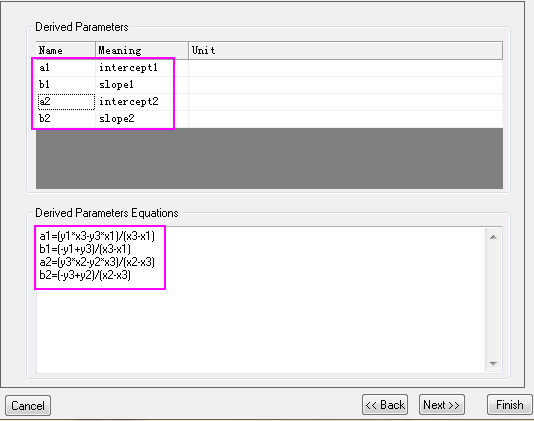
- Click <<Back button twice to go back to Variables and Parameters page, type a1,b1,a2,b2 in the Derived Parameters field.
- Click Next button four times to go to Derived Parameters page, fill in the Meaning column and type the equations in the Derived Parameters Equations area as follows, then click Finish button.
a1=(y1*x3-y3*x1)/(x3-x1);
b1=(-y1+y3)/(x3-x1);
a2=(y3*x2-y2*x3)/(x2-x3);
b2=(-y3+y2)/(x2-x3);
Fit the Curve
- Select Analysis: Fitting: Nonlinear Curve Fit from Origin menu. In the NLFit dialog, select Settings: Function Selection, in the page select User Defined from the Category drop-down list and pwl2s function from the Function drop-down list.
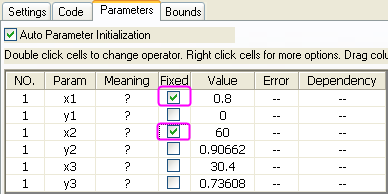
- In the NLFit dialog, select Parameters tab, and fix parameters x1, x2 as shown in the dialog.
- Click Fit button to fit the curve.
Fitting Results
The fitted curve should look like:
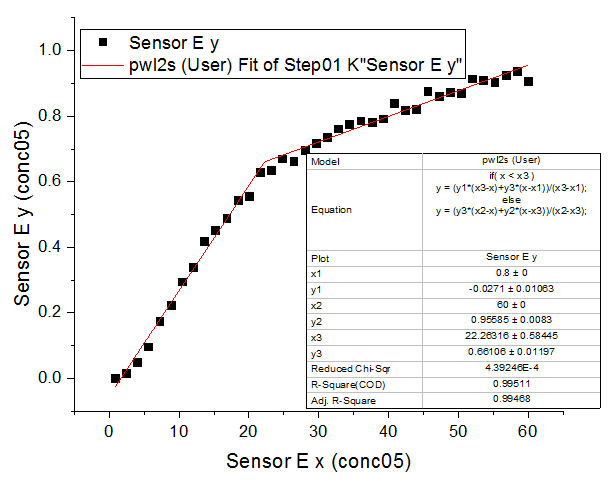
Fitted Parameters are shown as follows.
| Parameter
|
Value
|
Standard Error
|
| x1
|
0.8
|
0
|
| y1
|
-0.0271
|
0.01063
|
| x2
|
60
|
0
|
| y2
|
0.95585
|
0.0083
|
| x3
|
22.26316
|
0.58445
|
| y3
|
0.66106
|
0.01197
|
| a1
|
-0.05275
|
0.01123
|
| b1
|
0.03206
|
8.7153E-4
|
| a2
|
0.48715
|
0.01664
|
| b2
|
0.00781
|
3.86455E-4
|
Thus the intersection point for the two segments is (22.26316, 0.66106).
Note that fitting with a piecewise linear function for more than two segments can be done in a similar way.
|