4.2.2.1 Nonlinear Curve Fit ToolFitting-NLFit-Basic
Summary
Nonlinear fitting in Origin is performed using the NonLinear Fitting (NLFit) dialog box. The NLFit tool contains more than 200 built-in fitting functions used in many different disciplines.
 | To do a quick and simple fit without opening the NLFit dialog, try the Quick Fit Gadget.
|
Minimum Origin Version Required: 8.5
What you will learn
- How to fit with a built-in fitting function.
- How to change NLFit setting using Recalculate.
- How to define and fit with a user-defined function.
Use a built-in function to fit the data
- Click File:Open... to open the Intro_to_Nonlinear Curve Fit Tool.opj from the \Samples\Curve Fitting folder and select the Built-In Function folder from the Project Explorer window.
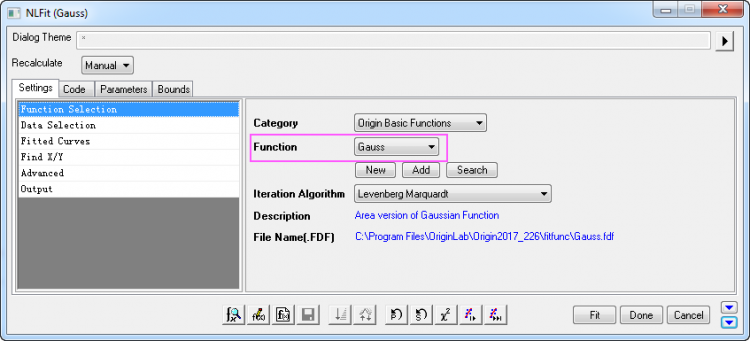
- With the Graph1 active, select the menu item Analysis: Fitting: Nonlinear Curve Fit to bring up the NLFit dialog, and then select Gauss from the Function drop-down list:
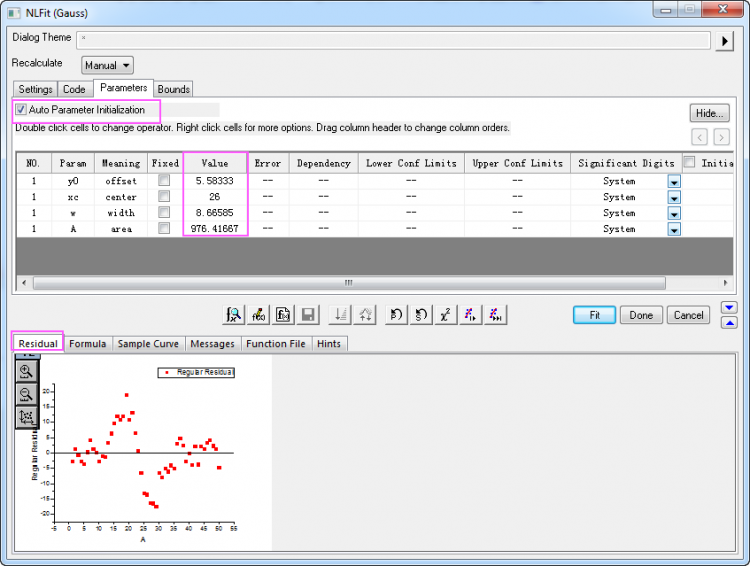
- In the Parameter tab, initial parameter values are automatically assigned, because the built-in functions have parameter initialization code.
If you go to the Residual tab, you can see the current residuals and decide whether the current fit results are acceptable.
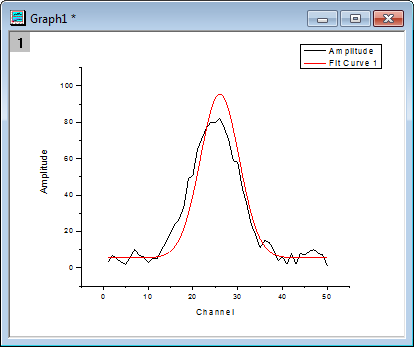
- Note that a fitted curve drawn using the initial parameter values, is shown in the graph.
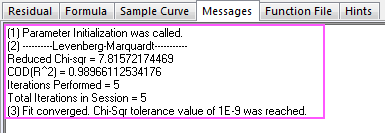
- Click the Fit until converged button
 .To see if the fitting operation was successful, click the Messages tab and note the number of iterations, reduced chi-sqr value, R^2 value, etc. .To see if the fitting operation was successful, click the Messages tab and note the number of iterations, reduced chi-sqr value, R^2 value, etc.
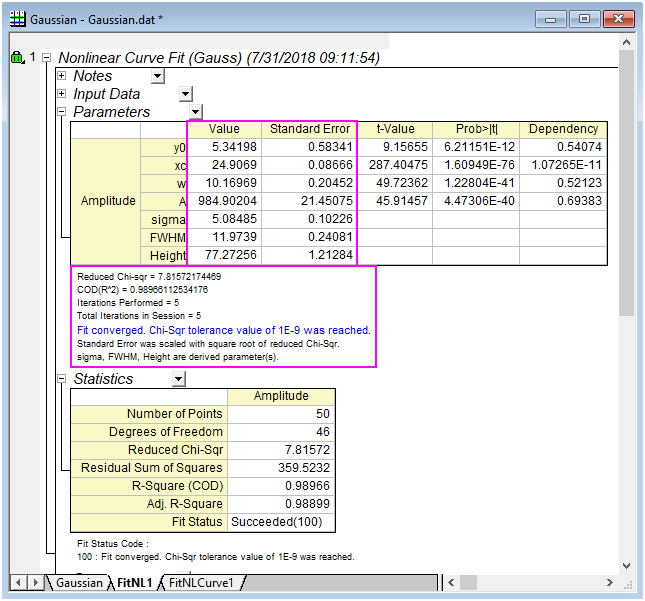
- Click the OK button. The FitNL1 report sheet is created with fit results including parameter values and fit statistics.
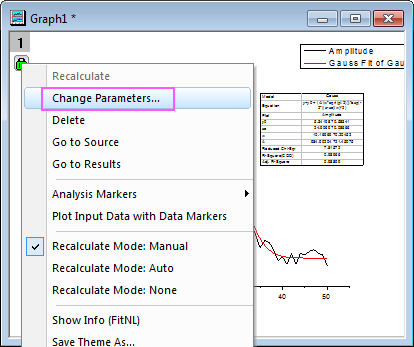
- Reopen the Nonlinear Curve Fitting dialog by clicking on the green lock icon on the upper left corner of the graph and selecting Change Parameters.
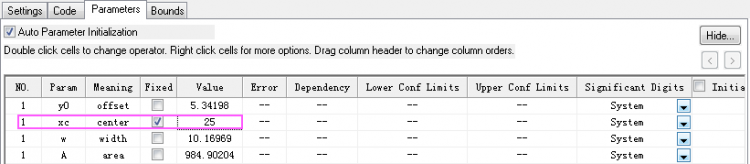
- Go to the Parameters tab, change the value of xc to 25 (note that by double-clicking in the cell, you can edit the value) and select the Fixed check box.
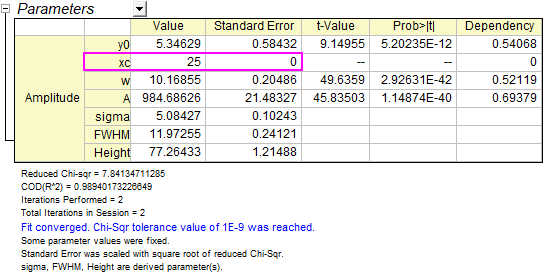
- Once again, click the Fit until converged button and then OK.
- In the report sheet, you can see that fixing the value of xc to 25 results in a Standard Error of 0.
Define and fit with a user-defined function
In this section, we will show you how to define your own fitting function and use it in the Nonlinear Curve Fit tool
Our function is y=y0+a*exp(-b*x)
- With the project file used in the first section opened. Select Tools: Fitting Function Builder... menu to bring up the Fitting Function Builder dialog box.
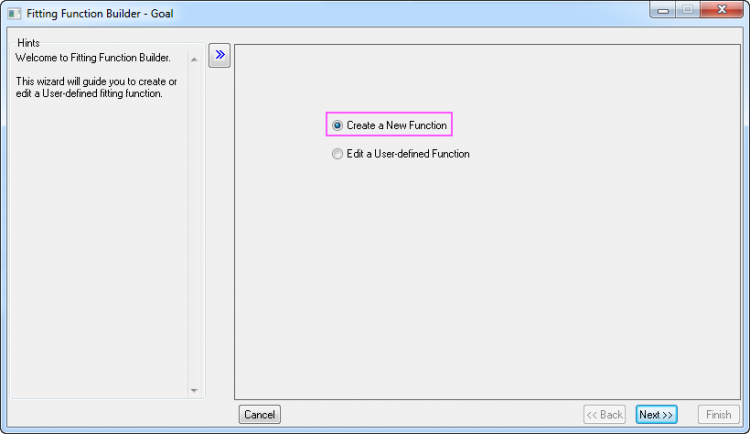
- On the Goal page, click Create a New Function, then click the Next button to go to the Name and Type page.
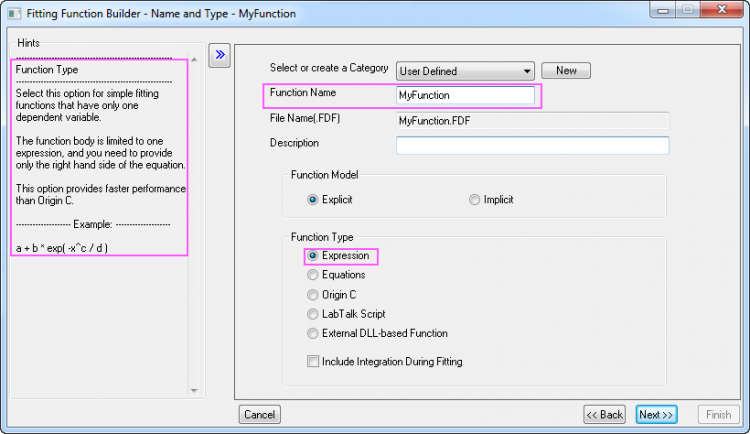
- On the Name and Type page, then name the function and select a Function Type. This function will be put to the User Defined category by default.
- Set MyFunction as the Function Name.
- Select Expression from the Function Type list. Note that the left panel displays Hints regarding the Function Type you selected.
- Click the Next button to turn to the Variables and Parameters page.
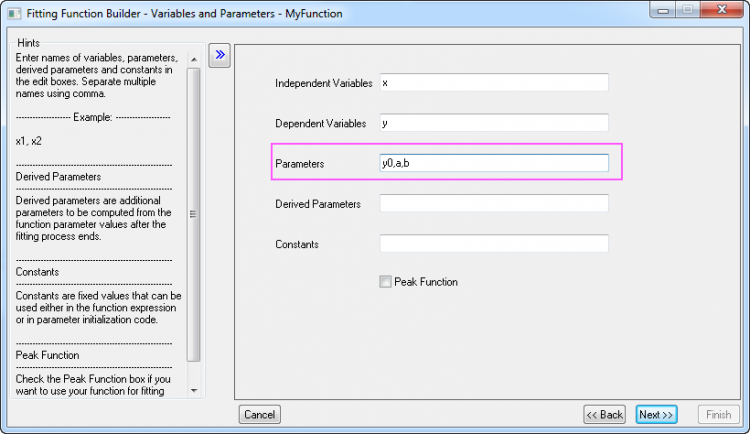
- On the Variables and Parameters page, make sure Independent Variables reads x and Dependent Variables reads y. Then input the comma-separated values y0, a, b into the Parameters text box. Click the Next button.
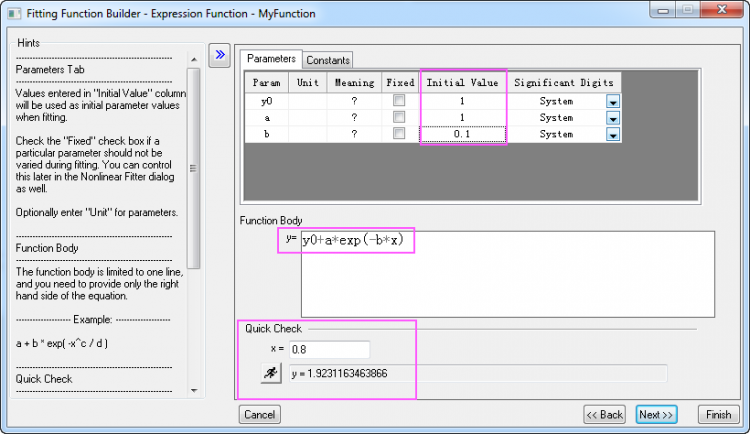
- On the Function Body page, perform the following operations:
- Set the Initial Values for parameters as shown below.
- In the Function body edit box, enter y0+a*exp(-b*x).
- Use Quick Check to check the validity of current function. After entering a value for the independent variables x, click the Evaluate button
 , you will get a return value of the dependent variable y which can be used to check the validity of this function. , you will get a return value of the dependent variable y which can be used to check the validity of this function.
- Click the Finish button to finish defining the function.
- Open Project Explorer (View: Project Explorer), and select the User-Defined Function folder.
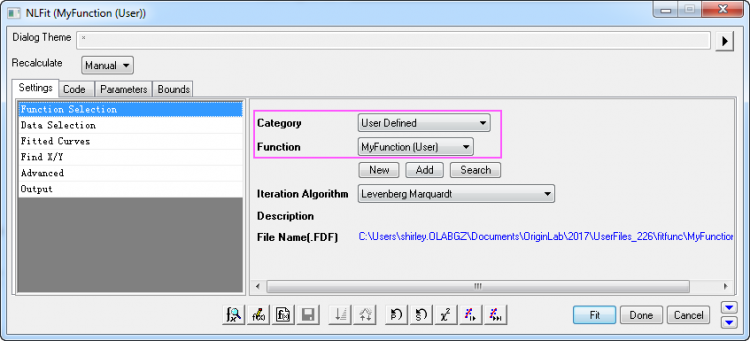
- Highlight column A and B in [Book1]Sheet1, select the menu item Analysis: Fitting: Nonlinear Curve Fit to bring up the NLFit dialog. Select the User Defined category and your function MyFunction on the Function Selection page, under the Settings tab:
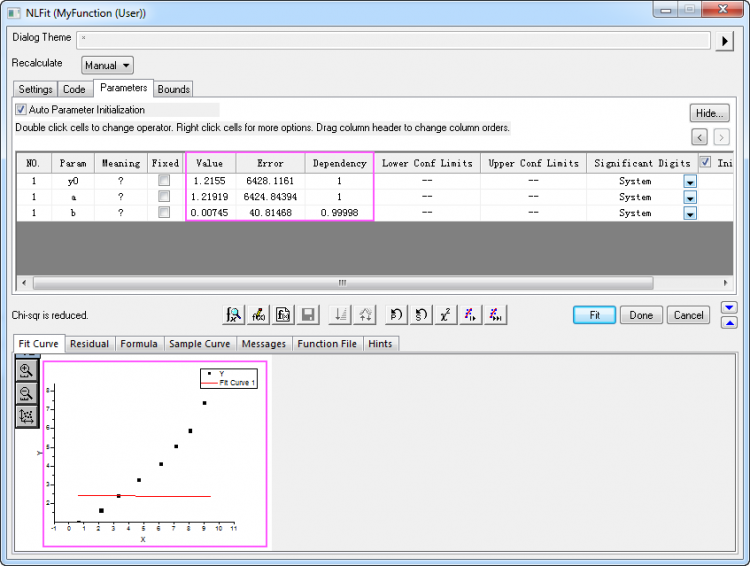
- By successively clicking the 1 iteration button, you can see the change in parameter values as well as the increasing conformance of the fitted curve.
- Click the "1 Iteration" button
 . .
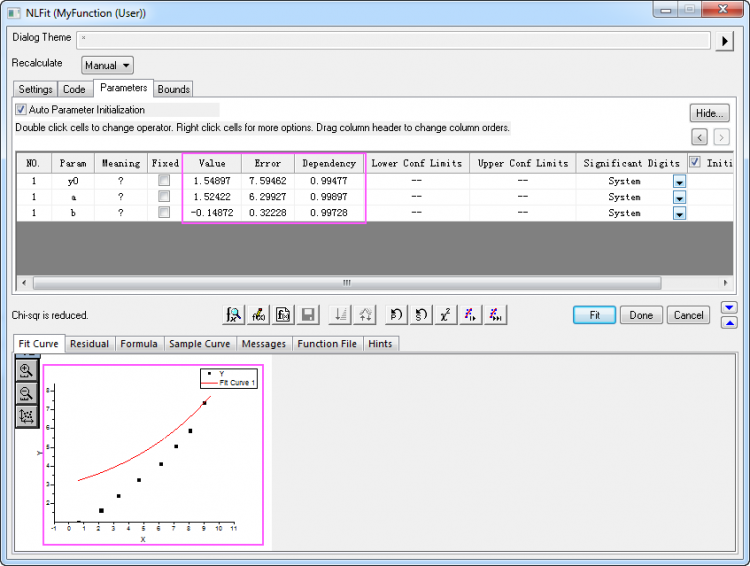
- Click the "1 Iteration" button again.
- Click the Fit until converged button
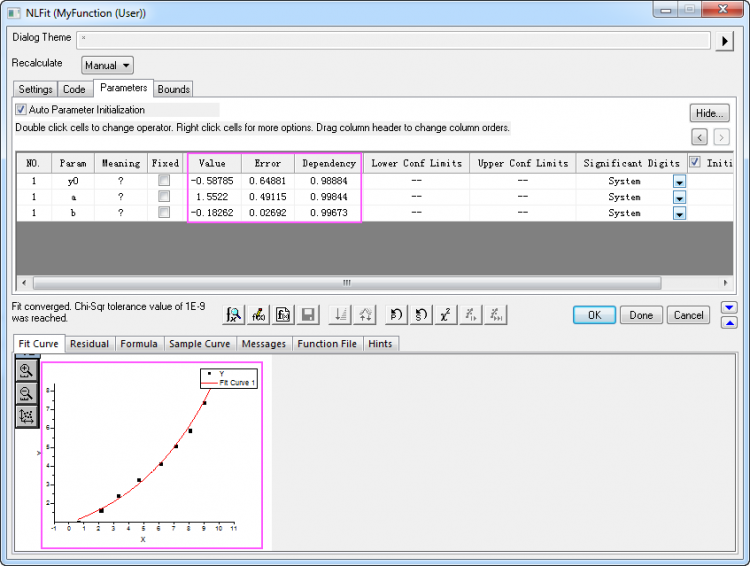
- Click the OK button and the FitNL1 report sheet of fitting results is created. Here, you will find best-fit parameter values and other fit statistics.
|