4.2.2.22 Fit Curve Through Certain PointsFitting-FixThroughPoint
Summary
This tutorial shows you three methods to force a fit curve to go thru a particular point. Choice of method depends on function expression and the data point you want the fit curve to go through.
What you will learn
- Learn different methods to force a curve to go through a point.
- Fix fitting parameters during nonlinear fitting.
- Use general linear constraints in nonlinear fitting.
- Fit with weights.
Example and Steps
Fixing Function Parameters
This method works only when the point you want to fit through is related to a function parameter. One typical example: force the fitted line to go through the origin point, (0, 0), when fitting a straight line,  . In this particular case we know that if we let . In this particular case we know that if we let  , the line will go through (0,0). , the line will go through (0,0).
- Import the data "\Samples\Curve Fitting\Linear Fit.dat" into an Origin worksheet.
- Highlight one of the Y column, column D for example, and select Analysis: Fitting: Nonlinear Curve Fit to bring up the NLFit dialog.
- Choose the Line function after selecting the Polynomial category.
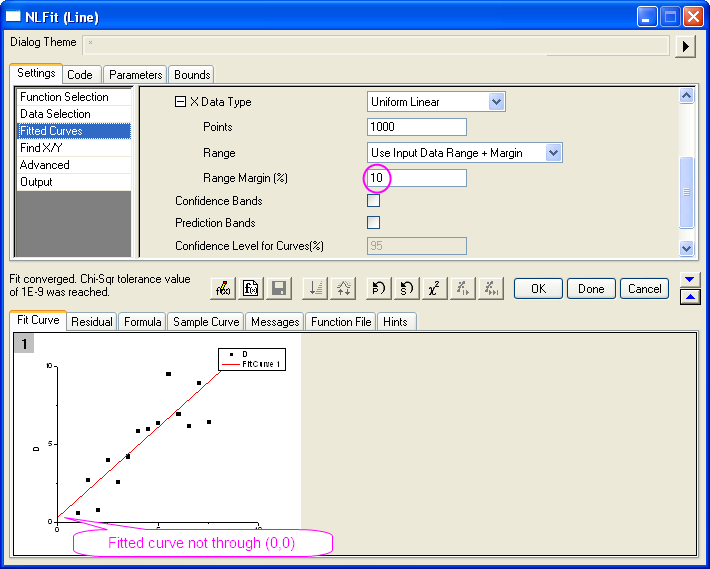
- Click the Fitted Curves page on Settings tab. Under the X Data Type branch, make sure the Range option is Use Input Data Range + Margin, and then enter 10 in the Range Margin(%) edit box. This option will lengthen the fitted curve.
- Click the Fit until converged button
 . You can see from the Fit Curve tab that the curve does not go through the origin point. . You can see from the Fit Curve tab that the curve does not go through the origin point.
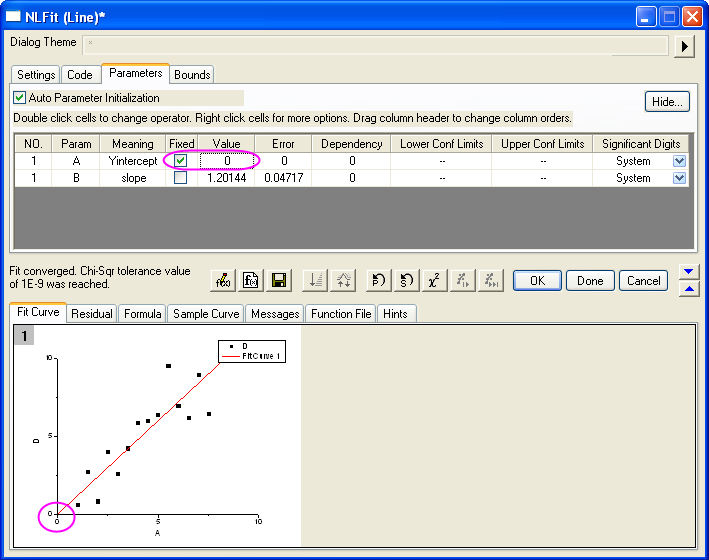
- Now go to the Parameters tab, check the Fixed checkbox for parameter A and fix the value to 0. Click the Fit until converged to fit the curve again. Now you can see the curve go through zero.
|
Note: You can also use the Fix Intercept option in the Linear Fit dialog to force the linear fitted line to go through the origin point.
|
Use Linear Constraint
This method works when the fitting function is based on a LINEAR model, such as Line, Parabola, or Cubic, etc.
We will show you how to force the fitted curve to go through a particular point by using linear constraint:
- Import the data "\Samples\Curve Fitting\Polynomial Fit.dat" into Origin worksheet.
- Highlight column B and press Ctrl + Y to bring up the NLFit dialog.
- Select Parabola (
 ) from the Polynomial category. From the Fit Curve tab, we can see the initial value already fits the data very well. ) from the Polynomial category. From the Fit Curve tab, we can see the initial value already fits the data very well.
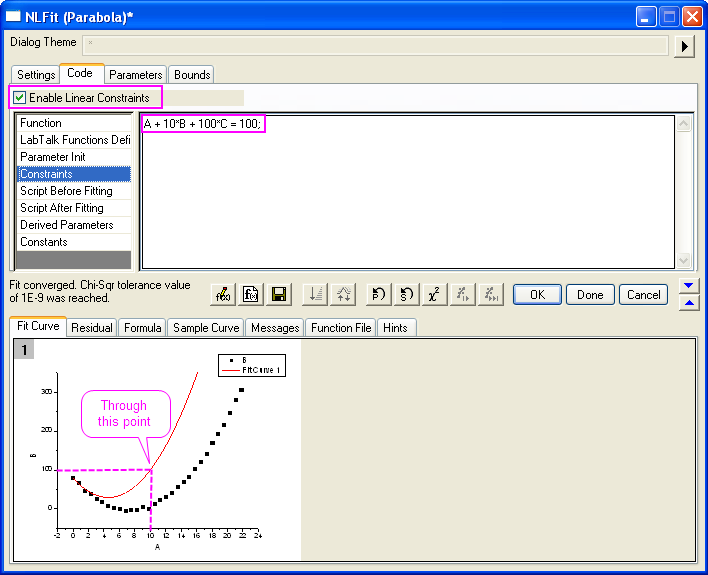
- Suppose we want to force the curve through
") . Substitute to the fitting function (). we then have . Substitute to the fitting function (). we then have  . We can use this equation as a general linear constraint condition.
Select the Constraints page on Code tab. Check the Enable Linear Constraints checkbox, and enter the following expression into the edit box. . We can use this equation as a general linear constraint condition.
Select the Constraints page on Code tab. Check the Enable Linear Constraints checkbox, and enter the following expression into the edit box.
A + 10*B + 100*C = 100
- Click the Fit until converged button . We can see the fitted curve deviates from the data points, but it goes through the specified point.
Use weighting
If the parameters are some eigenvalues such as upper or lower asymptotes, and your raw data includes the points you want to fit through, you can fit the curve by assigning larger weights to these particular points. This is not an analytical solution, but you can assign larger weights to reduce the error:
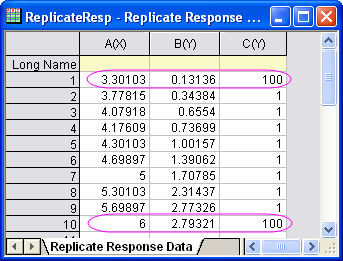
- Prepare data by running the following script:
newbook;
string fname$ = system.path.program$;
fname$ += "Samples\Curve Fitting\Replicate Response Data.dat";
impasc fname$ options.PartImp.Partial:=1 options.PartImp.LastCol:=2;
wks.addcol();
col(a) = log(col(a)) + 5;
col(c)[1] = 100;
for(int ii = 2; ii < wks.maxrows; ii++)
{
    col(c)[ii] = 1;
}
col(c)[wks.maxrows] = 100;
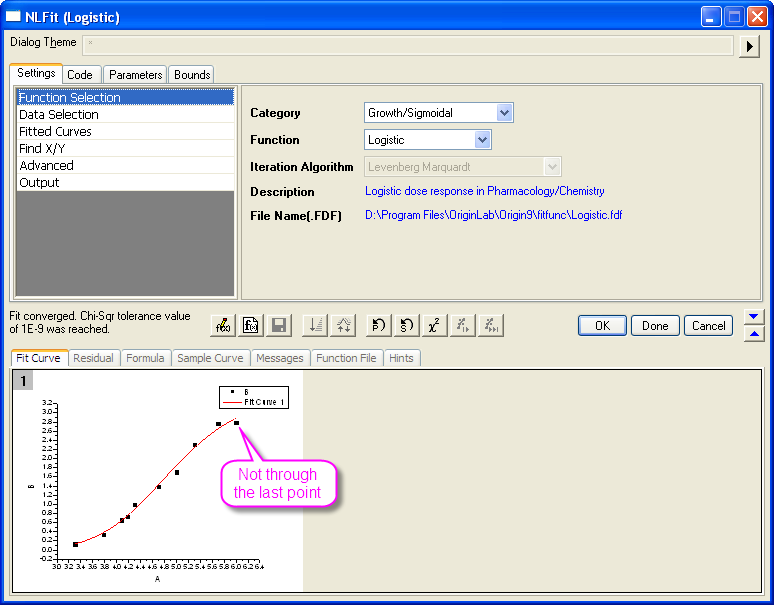
- First, let's see how the fitted curve looks when there is no weighting. Highlight column B and bring up NLFit dialog from Analysis: Fitting: Nonlinear Curve Fit. Select the Logistic function from Growth/Sigmoidal category. Then click the Fit until converged button . From the Fit Curve tab, we can see the curve does not go through any points near the top.
- Note that in the raw data worksheet, we have prepared column C and assigned large values for the first and last data points. If we use this column as weights, these two points will contribute more impact on the fitted curve and hence force the curve to go through these two points.
Now, activate the Data Selection page on the Settings tab. Expand the Input Data branch as below to expose the weighting option. Choose the Direct Weighting method and assign column C as the weighting dataset. Then click the Fit until converged button .
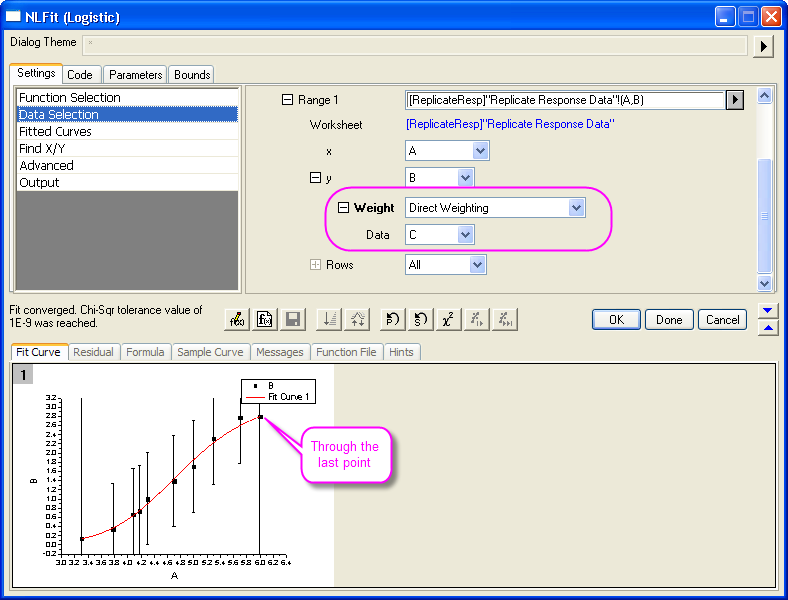
From the preview result, we can see that the fitted curve goes through the first and last data points.
|