4.7 Analysis ThemesAnalysisThemes
Summary
In Origin 8, analysis procedures can be controlled by Themes. Themes are actually XML files which save settings in the analysis dialog.For example, after performing the analysis, there will now be a <Last Used> theme for this dialog which has saved the most recently used settings. You can assign a proper name for the theme and use it in the future.
For this tutorial, the Statistics on Columns dialog will be used to demonstrate how to create and use an analysis theme. This analysis provides descriptive statistics about the data such as mean, standard deviation, minimum, maximum, and more. For visualization, a histogram or box chart can also be created in the Analysis Result Sheet.
Minimum Origin Version Required: Origin 8.0 SR6
What you will learn
This tutorial will show you how to:
- Perform simple descriptive statistics
- Create an Analysis Theme
- Use the theme
Steps
Save the analysis procedure as Theme
- Start with a new workbook and import the file \Samples\Statistics\automobile.dat.
- Highlight column C and use the menu item Statistics: Descriptive Statistics: Statistics on Columns to open the dialog.
- Select Quantities tab, then expand the Moments tree node, and check the N Total, Mean, Standard Deviation, SE of Mean and Sum box.
- Expand the Plots tree node, and check the Histograms and Box Charts check boxes. You will then get the corresponding histogram as well as box chart graphs.
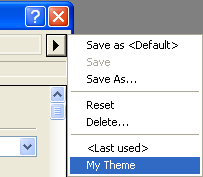
- Your selections in this analysis dialog can be saved as your theme, so that you may easily repeat the procedure. Click the arrow to the right of Dialog Theme and choose Save as... ...
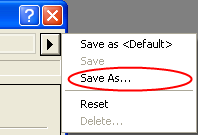
... to bring up this dialog:
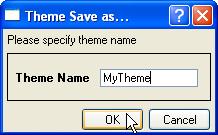
- Type a proper theme name, such as "MyTheme" and click OK.
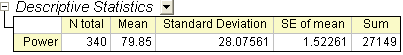
- Click the OK button in the Statistics on Columns dialog. Results are reported to a new worksheet named DescStatsOnCols1.
 | You can save a customized dialog theme as default, so it will be used every time you open the dialog of analysis operation. To do this, choose Save as <Default> to save the current dialog theme as the default setting of this dialog. It is also possible to delete the default theme and roll back to system default, to do this, choose Delete from the fly-out menu.
|
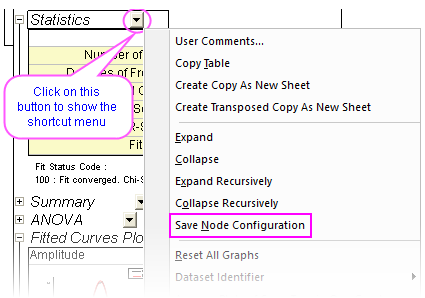
| You can save also save your Analysis Report Sheet configuration to a Theme file by expanding or collapsing output nodes, then choosing Save Node Configuration from the shortcut menu. For more information, see Save Node Configuration in this table.
|
Repeat the analysis procedure by Theme
Once you save a theme, there are many ways to use it. For example, you can highlight column E and perform the same statistical analyses on it.
- Open the Statistics on Columns dialog from the Most Recently Used items at the bottom of the Statistics menu. Most of the menu accessible dialogs can be opened from MRU menus.
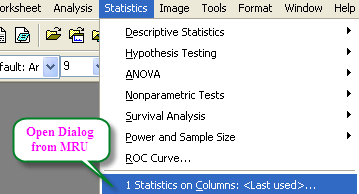
When you open the dialog from MRU, the default theme is <Last Used>. To use the MyTheme theme, select MyTheme from the Dialog Theme shortcut menu. The settings from that theme will then be displayed in the dialog. Click the OK button to do the analysis.
- Another way to apply the analysis theme is to use the cascaded menu item. Once you use an analysis dialog for the first time after installation, or save a theme for a dialog, there will be one more menu level added. You can choose the MyTheme menu.
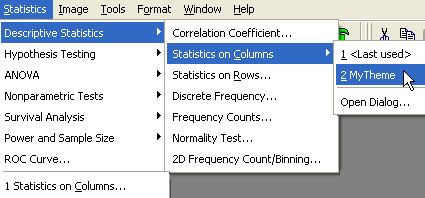
When selecting, Open Dialog..., the dialog will open to the <Factory Default> theme. To change the settings of your theme, you can select your theme name from the Dialog Theme shortcut menu inside the dialog, make changes, and resave the theme. Alternatively, to open a dialog with a saved theme without performing the analysis, hold down the shift key while selecting the theme from the menu. This will bring up the dialog with your theme applied so you can make changes as needed.
|