2.15 Time-Frequency AnalysisTime-Frequency-Analysis
Summary
This Time-Frequency Analysis app can be used to perform time-frequency analysis based on continuous wavelet transform, including the following features:
- Specify XY signal data, and get sampling interval from time (X) data automatically.
- Specify frequency range for the continuous wavelet transform.
- Wavelet types include Morlet, Derivative of Gaussian, and Mexican Hat.
- Output calculated scale value and pseudo-frequency.
- Output coefficient matrix and scalogram matrix.
- Create graph with raw data as line plot, and coefficient or scalogram contour plot.
- Support both scale vs time and frequency vs time contour plot.
Tutorial
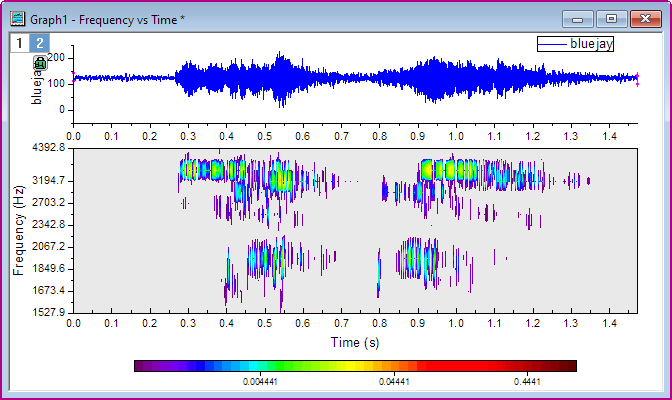
- With an empty worksheet activated, run the following LabTalk script in Script Window (Open by menu Window: Script Window) to import data.
fname$ = "%@ATime-Frequency Analysis\bluejay.wav";
impWav;
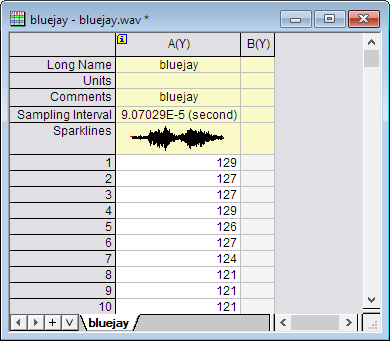
- Highlight column A of the imported data by clicking the column header, then launch the app by clicking the Time-Frequency Analysis icon
 from the Apps gallery. from the Apps gallery.
- In the dialog, set Frequency Range from 1500 to 4000, and Wave Number to be 20.
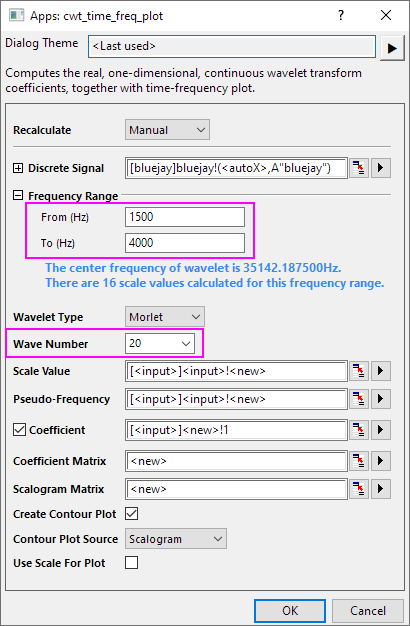
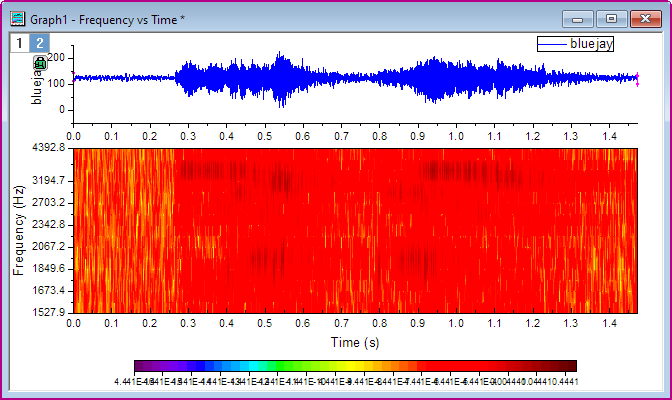
- Click OK button to generate the results, including scales, pseudo-frequency, virtual matrix for coefficients, coefficient matrix, scalogram matrix, and a graph with raw data plot and contour of scalogram matrix.
- Focus on the created graph. Double click on the contour plot on the bottom layer to bring up the Plot Details dialog. Under the Colormap/Contours tab, click the Level... header of the table to set the levels, as the following image shows, setting From as 5e-4.
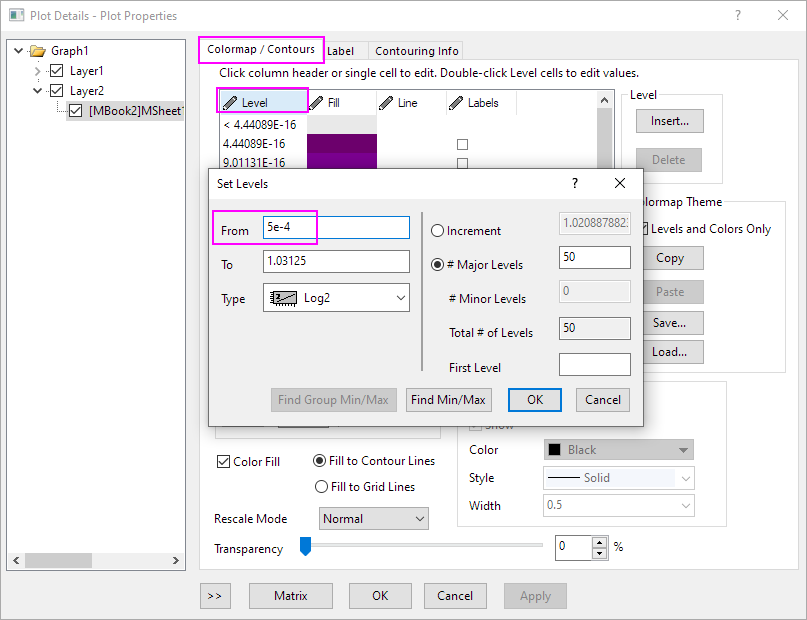
- Go back to Plot Details dialog and click OK button to finish the setting, and get the result graph.
Dialog Settings
File:Time Frequency Analysis 4.png
| Discrete Signal
|
The input signal data, should be XY data.
|
| Frequency Range
|
Specify the frequency range to calculate the scales for performing continuous wavelet.
- From (Hz)
- Start frequency value.
- To (Hz)
- End frequency value.
|
| Wavelet Type
|
Please refer to Wavelet Type in this page.
|
| Wave Number
|
Please refer to Wave Number in this page.
|
| Scale Value
|
Where to output the calculated scale value.
|
| Pseudo-Frequency
|
Where to output the pseudo-frequency.
|
| Coefficient
|
Which worksheet to output the coefficient as virtual matrix. It is optional.
|
| Coefficient Matrix
|
Where to output the coefficient matrix.
|
| Scalogram Matrix
|
Where to output the scalogram matrix.
|
| Create Contour Plot
|
Specify whether to create contour plot for the result. The graph will contain two layers vertically, the top one is a line plot for the raw signal data, and the bottom is a contour plot of the coefficient or scalogram matrix.
|
| Contour Plot Source
|
Specify which matrix is used for the contour plot, coefficient or scalogram.
|
| Use Scale For Plot
|
If this checkbox is true, the Y axis of the contour plot will use the scale value as label, otherwise, the pseudo-frequency is used.
|
Algorithm
- Continuous wavelet transform
Please refer to this page: https://www.originlab.com/doc/Origin-Help/CWT-Algorithm
- Scalogram calculation
Assume coefficient matrix (calculated from continuous wavelet transform) is matCoef.
First we compute the product of matCoef multiplied by matCoef itself element by element, to generate matrix matProd.
Then we get the absolute value of each value in matProd, to generate matrix matProdAbs.
Then we calculate the sum of matProdAbs as sum.
Finally, the scalogram matrix, matScalogram is calcualted as 100*matProdAbs/sum.
|