2.74 Bootstrap Sampling(Pro)Bootstrap-Sampling
Summary
The App Bootstrap Sampling is a powerful tool which can estimate the accuracy of a statistical estimate derived from a set of experimental data. The set of experimental data are got from random sampling with replacement.
Tutorial
- Download the project file from here and open it in Origin.
- Start this tutorial with the app Bootstrap Sampling installed. If you have not installed this app, please click Add Apps button in Apps Gallery to open App Center to search and install the app.
Example 1: Basic Statistics
We have a list of Fortune 500 CEO salary and want to figure out what is the proper salary for a Fortune 500 CEO in that year. As the salaries vary in a wide range, it is good to evaluate the salary with the median value, which is the
salary in the middle. With the Bootstrap Sampling app , we can also get confidence intervals of the statistics.
- Highlight column G and click the Bootstrap Sampling icon
 from Apps Gallery. from Apps Gallery.
- Column G is automatically set as Input Data. Make sure Statistics on Column is selected
-
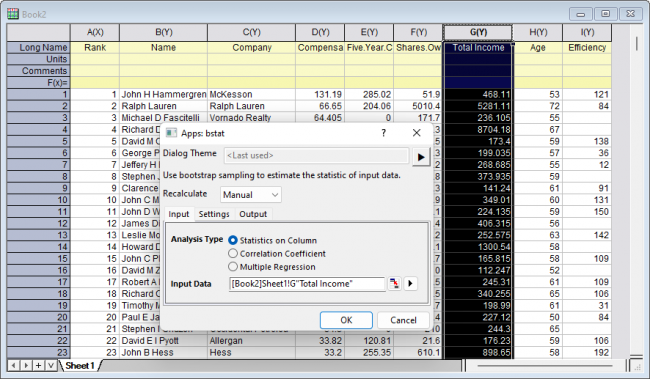
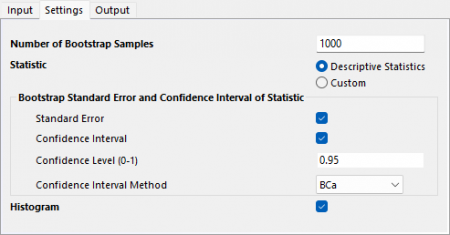
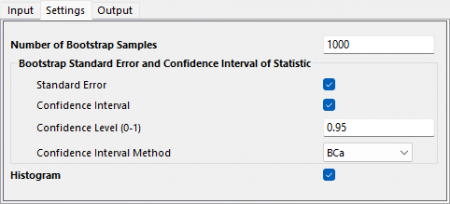
- In the Settings tab, keep the default settings. Click OK button to apply settings and close dialog
- Some tips:
- Keep Number of Bootstrap Samples to be 1000, that means, we will simulate 1000 datasets from the salary list and calculate the statistics from them to get bootstrap confidence intervals.
- For Statistic, if select Custom, we can specify a Labtalk function and calculate the value with bootstrap sampling method, such as, median, sem
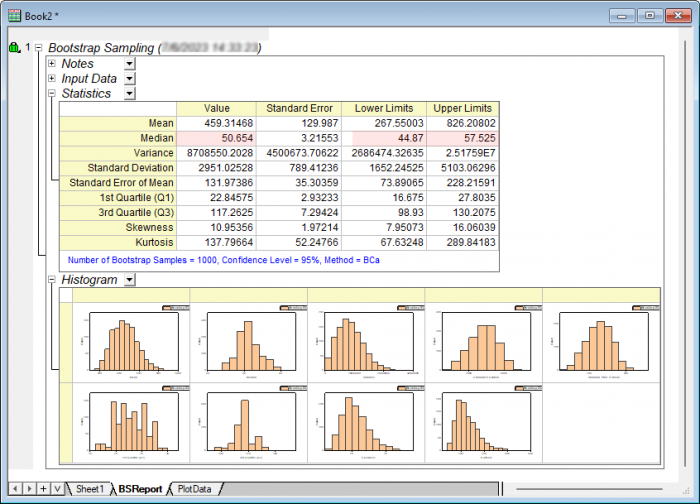
- From the result we can see, the median salary is 50.654 and We are 95% certain that the true median lies within in the interval [44.87, 57.525]
- Note: Please note that bootstrap is a resampling method. . Bootstrapping uses random sampling with replacement to estimate statistics from a sample. So , there would be slight difference between results when we run the bootstrap sampling tool, even for the same source data and same settings.
-
Example 2: Correlation Coefficients
Is the CEO salary related to Efficiency?
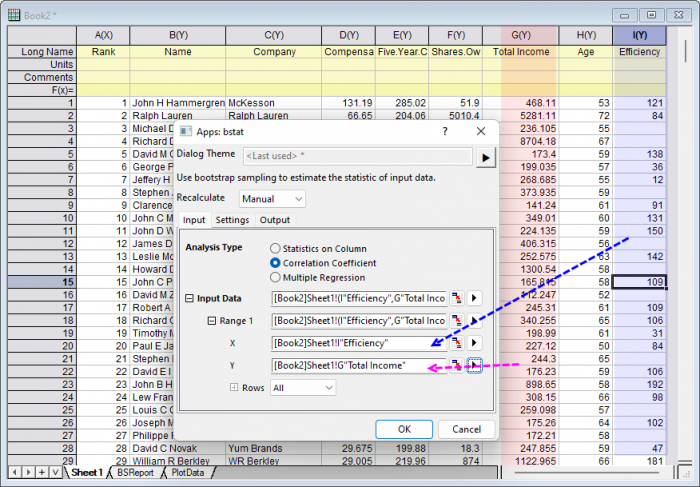
- Go back to Sheet1. Click the Bootstrap Sampling icon from Apps Gallery.
- In the opened dialog, choose Correlation Coefficient this time. Expand the Input Data branch, set X to be column I and Y to be column G
-
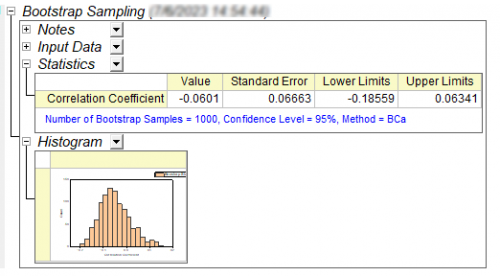
- In the Setting tab, keep Number of Bootstrap Samples to be 1000 and Confidence Interval Method to be BCa
- From the result We can see the correlation coefficient is -0.0601. It is a negative value and close to 0. that means, the CEO salary has nothing to do with the company efficiency and we can say it is a little negative related. That is , the higher the CEO salary is, the lower the company efficiency may be.
Example 3: Multiple Linear Regression
The scientist is interested in how Power, 0~60 mph, weight and gas mileage affect engine displacement for a car. He can only collect such data of 8 samples and want to establish a multiple regression model for the estimation
Please note that if the sample size is not large enough, the MR model is easy to be overfit, that overstates the confidence interval.
Bootstrap Sampling is a proper tool for such case to give more accurate results for standard error and confidence interval values
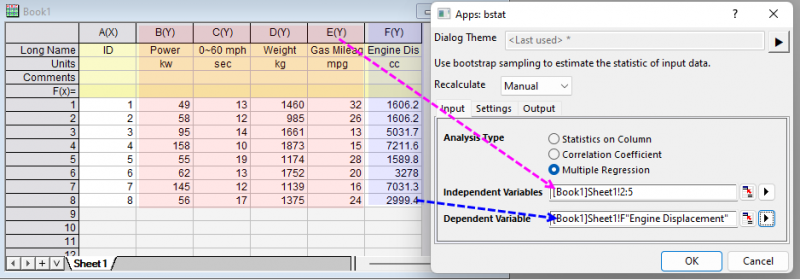
- In the sample project file, select folder 2. Cars. Click the Bootstrap Sampling icon from Apps Gallery.
- In the opened dialog, choose Multiple Regression. Set column B~E to be Independent Data. Set Column F to be Dependent Data. Keep all default settings and click OK button.
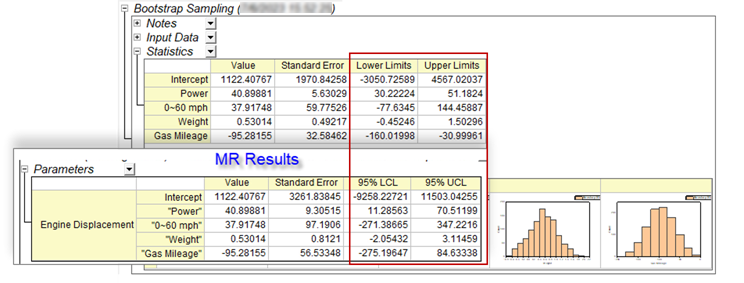
- The parameter estimations of MR results in Bootstrap Sampling tool is the same as the normal Multiple Linear Regression tool, but bootstrap results have smaller standard error and narrower confidence intervals for each parameter.
|