2.70 Structural Equation Modeling(Pro)SEM
Summary
The App Structural Equation Modeling is used to perform structural equation modeling optimization.
Tutorial
This tutorial will introduce how to use the app with two samples. Please firstly download the sample project.
Multivariate Linear Regression
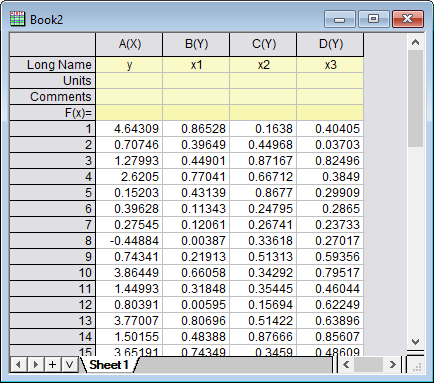
- Open the project you just downloaded, go to the subfolder "Multivariate Linear Regression" in Project Explorer. As you can see, in the workbook, there are three x columns and one y column. We are going to perform multivariate linear regression with the app Structural Equation Modeling.
-
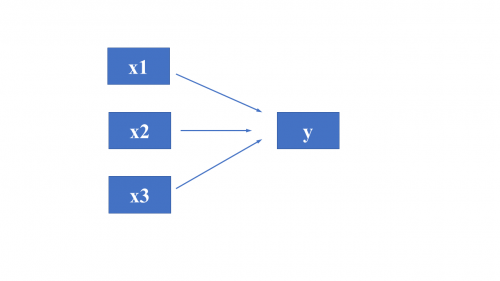
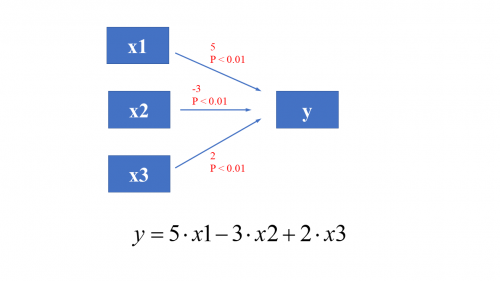
- Here is the path diagram for the SEM. All of them are observable variables.
-
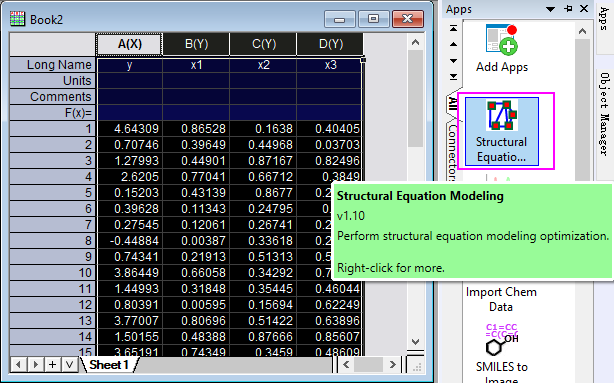
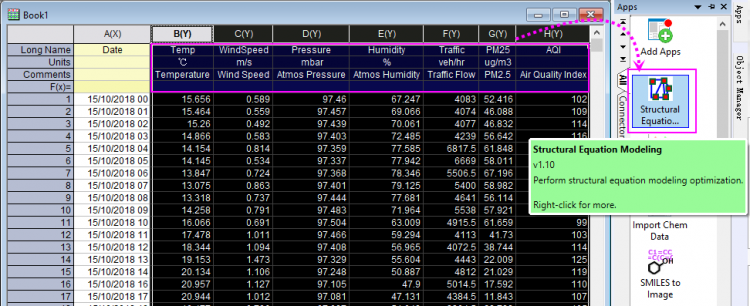
- To run this app, highlight the four columns and click the icon in the Apps Gallery.
-
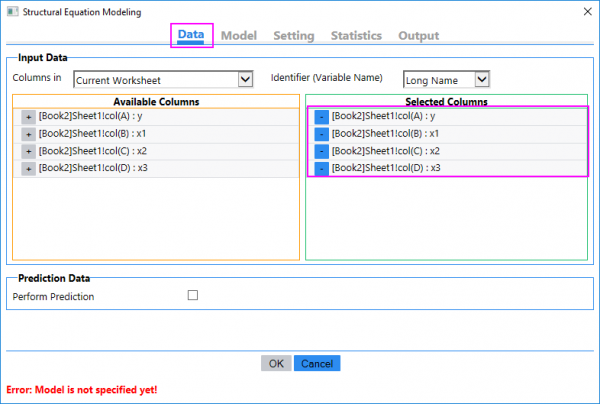
- In this dialog opened, the highlighted columns will be selected as Selected Columns automatically in Data tab..
-
- Choose Model tab, in which we will establish the model for ananlysis. We can choose Typing for Specify Description By drop-down list and type the syntax of model in Description box. Here in the syntax, y, x1, x2, x3 are long name of source columns.
-
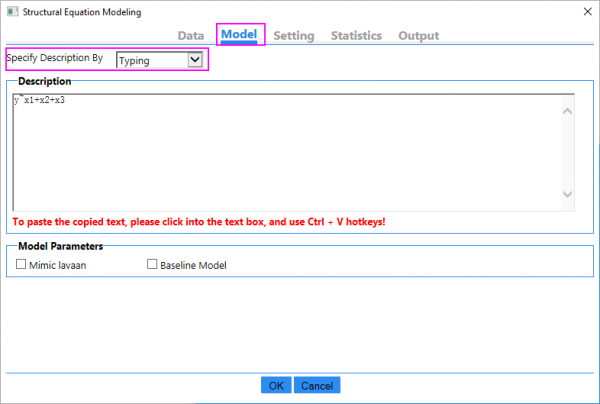
- Or, we can also choose Definition for Specify Description By drop-down listto define the model step by step. We will show this in more details in the second example.
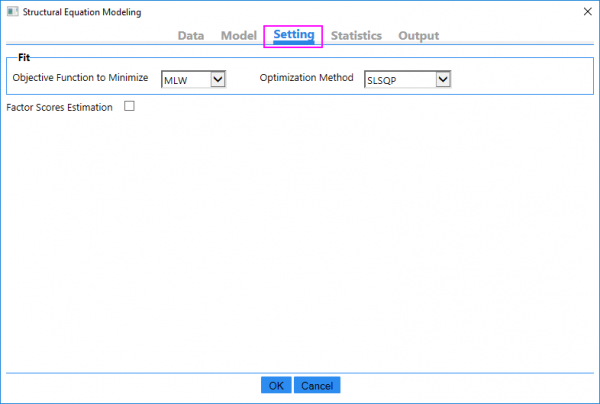
- The Setting tab enables us to select Objective Function to Minimize and Optimization Method. Let's accept the default settings.
-
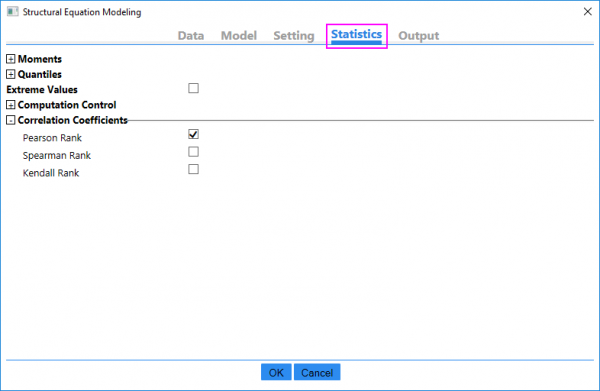
- In the Statistics tab, we can choose what descriptive statistics of the variables to be output. Let's accept all default settings too.
- In the Output tab, let's also accept the default setting and click OK button to output the results to a new sheet.
- In the sheet SEMReport, the p values of three x variables are smaller than 0.05 which means the variables are statistical meaningful in the model.
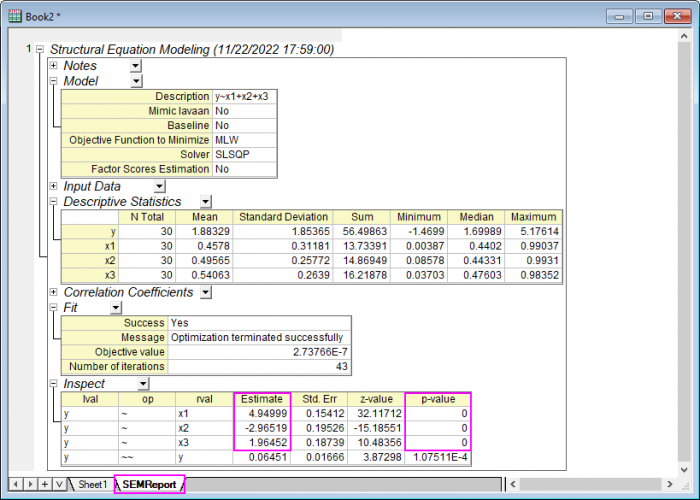
- Finally, we can establish the model by the estimation of coefficients: y = 5*x1 - 3*x2 + 2*x3
Air Quality
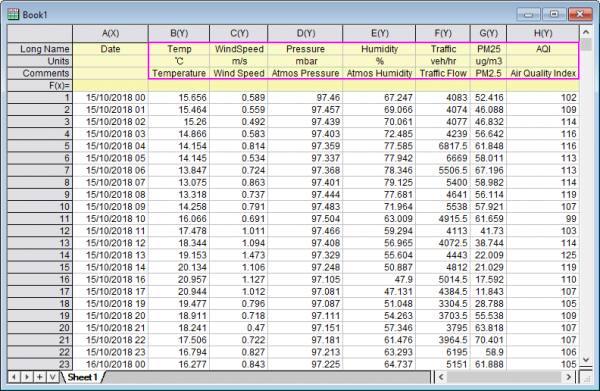
- Swicth to the subfolder "Air Quality" in Project Explorer. In the example we have values of temerpature, wind speed, atmospheric pressure, atmospheric humidity, traffice flow during a period, and hope to know how they affect air quality. The air quality are reflected as values of PM 2.5 and Air quality index.
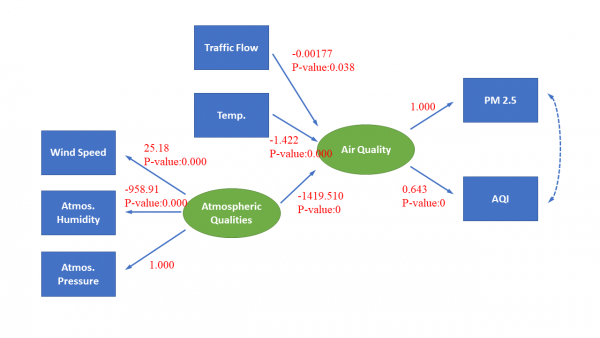
- First, let's establish the model with the path diagram.
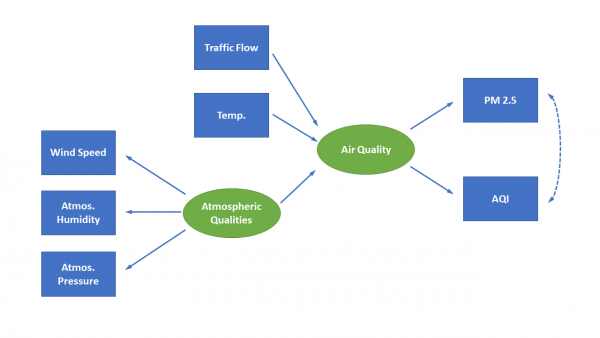 - We are considering to describe wind speed, atmospheric humidity and atmospheric pressure to be atmospheirc qualities. So atmospheric qualities is a latent variable. We want to know how traffic flow, temperature and atmospheric qualities affect air quality. The air quality will be refected as values of PM 2.5 and air quality index. So the air quality is also a latent variable.
- Please note that PM2.5 and air quality index should be correlated. We should consider this in the model.
- Highlight column B ~ H in the worksheet, click the app icon to open the dialog.
- In the Data tab, all Y columns has been selected.
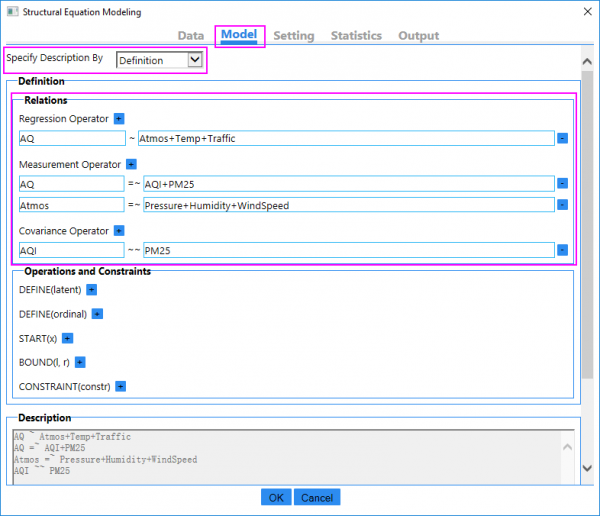
- Go to Model tab, this time we select Definition in the drop-down list to establish the regression model in Regression Operator branch.
- There is a message said that AQ and Atmos are missing from data. That because they are latent variable. We can defined them in the Measurement Operator branch.
- PM2.5 and Air Quality Index should be correlated so we are going to add them in the Covariance Operator branch.
- Click OK button to output the results.
- In the result sheet, all the P values are smaller than 0.07. It is not so strong significant but some kinds we can still say the the variables are statistical meaningful in the model.
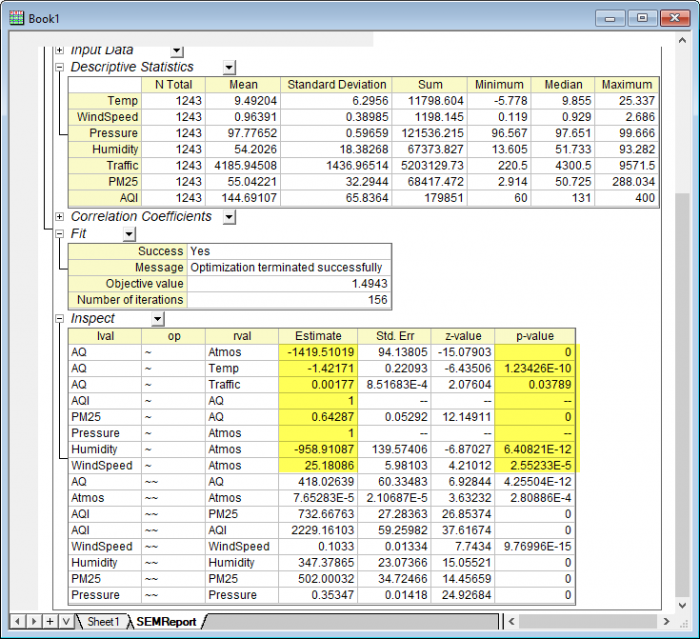 - The coefficient estimation of traffic flow is -0.00105, that means traffic flow has very small effect on air quality. We may consider to remove it from the model.
- For temperature, it is -3.348, that is , temperature has some effect on air quality, but look at the coefficient of atmospheirc qualites, which is -1045.270. We can say atmospheric qualities have more effect on air quality than temperature.
- To learn more about the syntax of constructing the Structural Equation Modeling, please click the link on the file exchange page of the app. The opened page listed all detailed information for syntax of the tool.
|