2.61 Neural Network Regression (Pro)Neural-Network-Regression
Summary
This Neural Network Regression app is used to fit data with neural network backpropagation. It trains a neural network to map between a set of inputs and output. The app can be used to predict response of independent variables.
 | Required Python library for the app
Other dependent Python libraries
| joblib
|
threadpoolctl
|
numpy
|
scipy
|
The required library and other dependent Python libraries will be automatically installed when the App is launched the time.
|
Sample OPJ
- Right click on the app in Apps Gallery and choose Show Samples Folder from the context menu
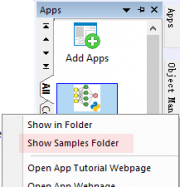
- Drag and drop the project file in the opened folder to Origin to open it
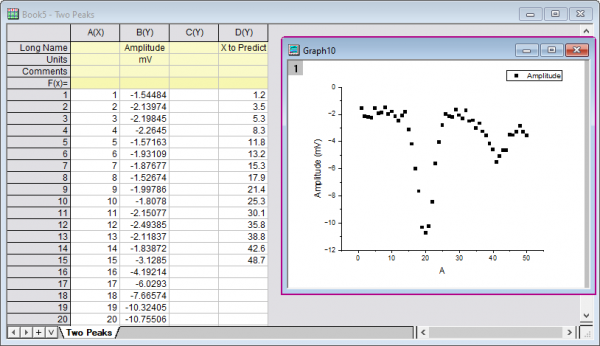
Example 1: Two-Peaks Curve Fitting
We have a curve with two peaks, and want to fit it with network backpropagation. We will then predict Y values from given X values.
| There is no fixed way for finding the best settings of the model. The settings often require several attempts based on your data, to optimize the results.
|
- Make sure we opened folder 1. Two Peaks
- Create a scatter plot graph from column A and B of Book5. Activate the graph and click on the Neural Network Regression icon in the Apps Gallery to open the dialog
- Input is filled automatically with the 1st plot on graph
- In the Options tab, change the settings as below. and click OK button
-
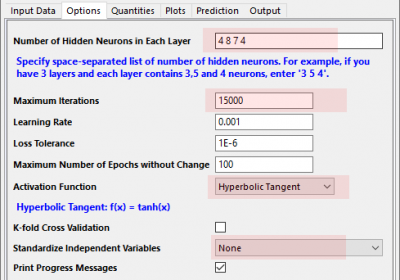
- "4 8 7 4" is the number of neurons in each hidden layer. (The selection of an architecture for your neural network can only be done by trial and error. You can refer to the reference page as a starting point.)
- Hyperbolic Tangent is chosen as Activation Function because we are going to fit a nonlinear curve. Both Hyperbolic Tangent and Logistic are good for nonlinear curve with peaks.
- Standardize Independent Variables is set to be None. If the variables are measured in different scales, you can standardize variables. We do not need that for the present data.
- A new book with Neural Network Regression result is generated
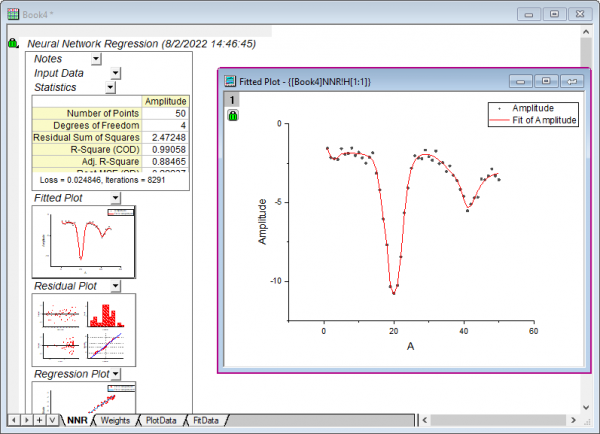
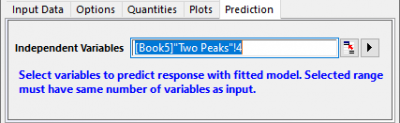
- Now we are going to predict Y from given X values. Click the green lock on the report sheet and choose Change Parameters from the menu.
- In the Prediction tab of the dialog, select Col(D) as Independent Variables and then click OK
-
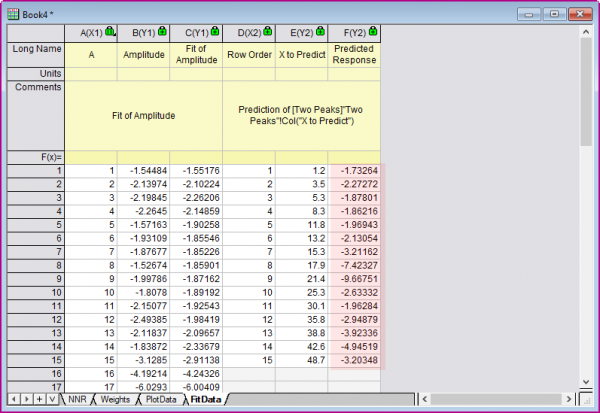
- We can find the predicted Y values in the sheet FitData
Example 2: Multiple Linear Regression
We have three independent variables and one dependent variable, and want to study the relationship between them:
-

- Switch to folder 2. Multiple Linear Regression in the Project Explorer
- Activate Book6, click on the Neural Network Regression icon in the Apps Gallery to open the dialog
- In the Input tab, set Independent Data to be Column A ~ Column C, Dependent Data to be Column D
- In the Options tab, set settings as below. Then click OK to generate results
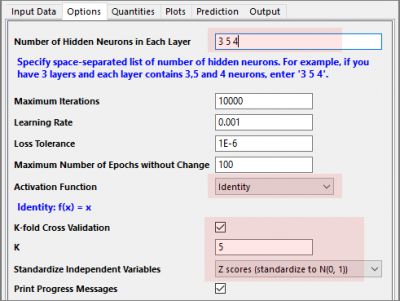
- "3 5 4" is the number neurons in each hidden layer. We have three independent variables so it is good to have three hidden layers. (The selection of an architecture for your neural network can only be done by trial and error. You can refer to the reference page as a starting point.)
- Identity is chosen as Activation Function as we are going to fit a linear model.
- Set K = 5 which means split the data sample into 5 groups for cross-validation. In cross-validation, each training data is treated as the test data, and is excluded from training data to judge which group it should be classified to, and then verify whether the classification is correct or not.
- Standardize Independent Variables is set to be Z scores.... Use the option to make all the variables to be in the same scale during fitting.
Using Results in Python from the Trained Model
Suppose the NNR result we got in last part is Book2. We have prepared new independent values in column A ~ C' of Book1 and want to predict the new results from the model established in Book2
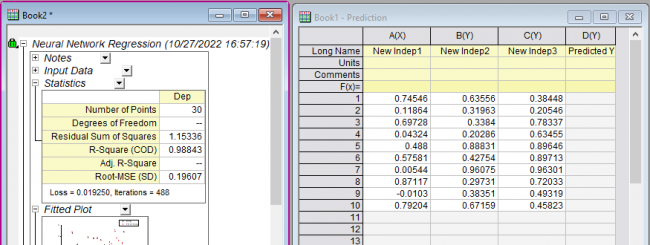
The Python codes below show how to predict dependent values for new independent values based on the trained model in NNR sheet. The python codes will read new input values from column A ~ C of Book1 and put prediction results in column D
Steps to run the codes
- Choose menu View: Code Builder to open Code Builder
- Choose menu File: New in Code Builder and create an empty Python file
- Copy and paste the codes below to the Python file
- Press F5 to run it
#The workbook with NNR result saved the neural network regression model
#Before running the code, you should activate the workbook
from sklearn.neural_network import MLPRegressor
import originpro as op
import PyOrigin
import numpy as np
import sys

app_dir = PyOrigin.LT_get_str('%@A')+"Neural Network Regression" #get App folder path
sys.path.append( app_dir ) # add App folder path to sys
import nnr
model=nnr.LoadRegressionModel() #get saved model from active workbook

#after loading the model, specify the x data to predict
wks = op.find_sheet('w', '[Book1]Sheet1') #find the sheet with x to predict
x = wks.to_list2( 0,-1, 0,2 )#wks.to_list2(r1,r2,c1,c2)

wksTrain = op.find_sheet('w', '[MultipleLine]Multiple Linear Regression') #find the sheet with x to train
xTrain = wksTrain.to_list2( 0,-1, 0,2 )#wks.to_list2(r1,r2,c1,c2)

#if train data was standardized before fitting, you should also standardize x before prediction
#if not standardized, use default options
#nnr.FormTrainData(xpred, normalize='none', xTrain=None)
#normalize:{'none','standard','minmax'},default='none','standard':Z score, 'minmax':normalize to (0,1)

x_pred=nnr.FormTrainData(x,'standard',xTrain) #transform x data into proper data format, standardized by train data
y_pred =model.predict(x_pred)#predict y

wks.from_list( 3,y_pred,'Predicted Y' )#output predicted y
|