2.77 Sparse Principal Components Analysis(Pro)Sparse-PCA
Summary
This Sparse Principal Components Analysis app performs sparse pca on multi-variate data sets.
Sparse principal component analysis is a variant of PCA. While PCA find principal components which are linear combination of all input variables, Sparse PCA improved to select principal components whose linear combinations that contains only a few input variables. Thus the tool is useful in exploring structure and patterns in data.
Tutorial
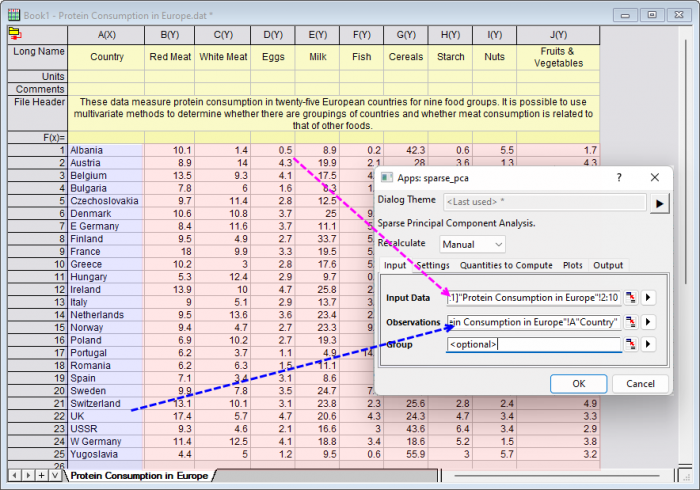
- With a worksheet window activated, select menu Data: Connect to File: Text/CSV to import the sample file <Origin program folder>\Samples\Statistics\Protein Consumption in Europe.dat
- Click the Sparse Principal Components Analysis icon
 from Apps Gallery to open the dialog from Apps Gallery to open the dialog
- In the Input tab, select column B~ J to be Input Data, select column A to be Observations
-
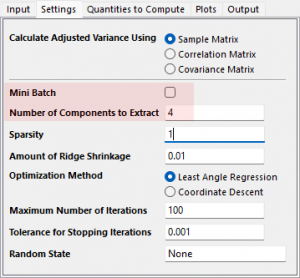
- In the Settings tab, clear Mini Batch check box, we will perform Sparse PCA on data, set Number of Components to Extract to be 4
- Mini-batch sparse PCA is a variant of Sparse PCA that is faster but less accurate. We have a small dataset, it is fine to choose Sparse PCA instead of Mini-batch sparse PCA
- To define the proper number of components to be extracted, we have two methods
- Refer to the decision of normal PCA tool: Please refer to the tutorial for how to do
- Observe the Cumulative(%) value from Adjusted Variance table get in this tool. We can change parameter to change the number of extracted components until we get the largest Cumulative(%) value
-
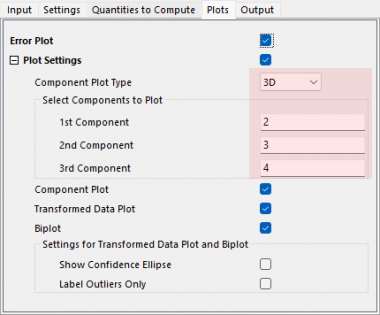
- In the Plots tab, set the Component Plot Type to be 3D and set the 1st, 2nd, 3rd component to be "1", "2" and "3". Click OK button to apply settings and close dialog
-
Interpreting The Results
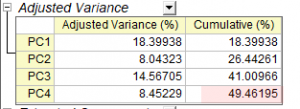
- From the Adjusted Variance table, we can see the first 4 PCs explain 49% of the variance.
- Note: You can click the green lock on the sheet and select Change Parameters, then change the value of Number of Components to Extract until you get the largest Cumulative(%) value
-
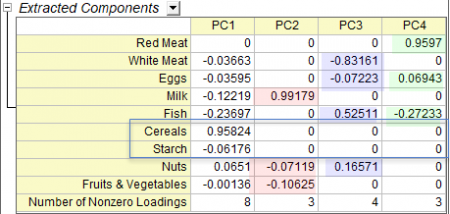
- From the Extracted Components table, we can see how the main component variables are defined. Sparse PCA improved to select principal components whose linear combinations that contains only a few input variables. So it is clear to see how the principal components are defined and how the variables are grouped. For example, from the result table below, we can see
- Milk, Nuts and Fruits & Vegetables define PC2
- White Meat, Eggs, Fish, and Nuts define PC3
- Red Meat, Eggs and Fish define PC4
- In addition, Cereals and Starch are only can be defined in PC1, they are similar variables
-
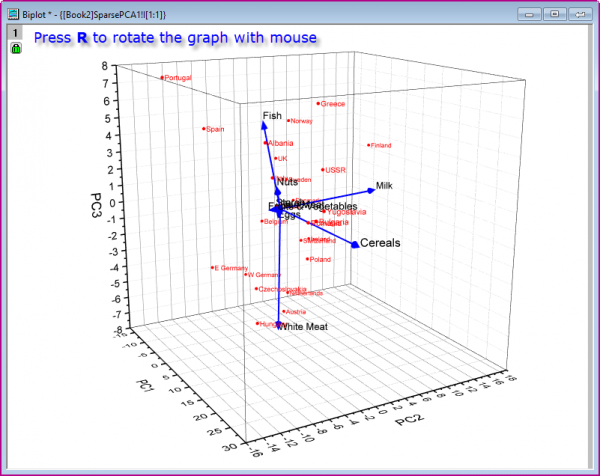
- We can also observe the classification of variables and observations from the Biplot, which is on the sheet SparsePCA1. Double click on the embedded graph to open it as a individual window. To observe the graph, we can press R to rotate the graph with mouse
-
|