2.64 MANOVAMANOVA
Summary
MANOVA app performs one-way and two-way multivariate analysis of variance (MANOVA).
Tutorial
This tutorial uses App’s built-in sample project. To open this sample OPJU file:
- Right click the MANOVA App icon
 in the Apps Gallery and choose Show Samples Folder. in the Apps Gallery and choose Show Samples Folder.
- A folder will open. Drag-and-drop the project file MANOVA_Sample.opju into Origin.
| Notes: If you want to save the project after changing, it is recommended saving it to a different folder location (e.g. User Files Folder).
|
One-way MANOVA
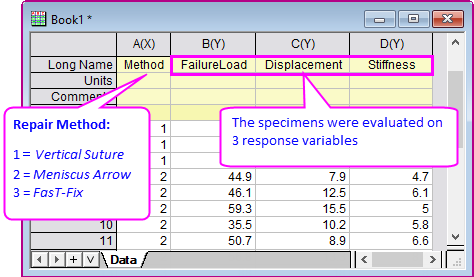
- Expand Project Explorer docked on the left. Select folder One-way MANOVA. There is a workbook containing data from a study of comparing repair methods for cadaver knees.
- Click the MANOVA icon in the Apps Gallery. It will open a MANOVA toolbar.
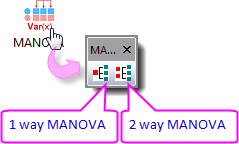
- Click the first button to open the oneWayMANOVA dialog.
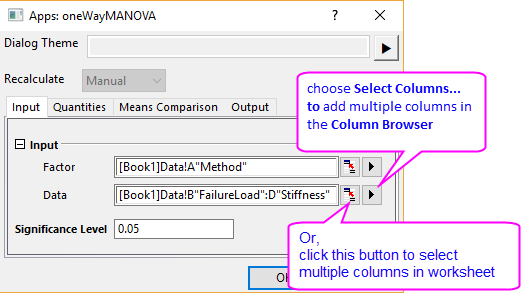
- On the Input tab, select col("Method") for Factor and col("FailureLoad")-col("Stiffness") for Data. Leave Significance Level to 0.05.
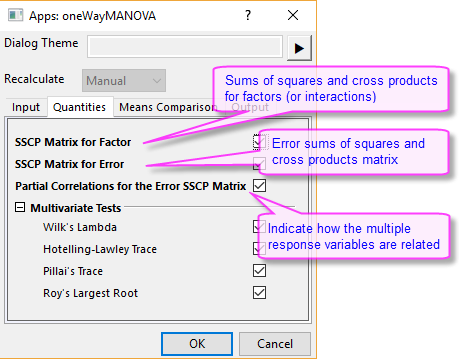
- Go to the Quantities tab. All quantities are checked by default.
- Go to the Means Comparison tab. Make sure Bonferroni method is selected to perform post-hoc pairwise comparisons.
Click OK.
- The report sheet MANOVA1Way from the One-Way MANOVA analysis is added to the workbook.
Results Explanation
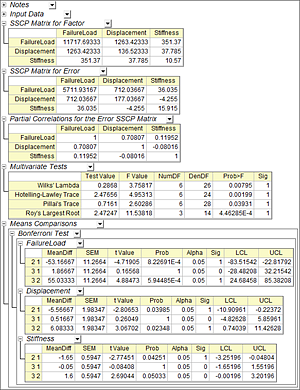
- The SSCP Matrix for Factor table represents the treatment sums of squares and cross products (SSCP), e.g., SSCP attributed to Meniscus Arrow repair method. The diagonal elements are the univariate ANOVA sums of squares. The off-diagonal elements of this matrix are the cross products.
- The SSCP Matrix for Error table represents error sums of squares and cross products. The diagonal elements of this matrix are the univariate ANOVA error sums of squares for the response variables. The off-diagonal elements of this matrix are the cross products.
- The Partial Correlations for the Error SSCP Matrix table represents how strong the response variables are related. Lower value means the two response variables are less related. In this example, Stiffness is weakly related with FailureLoad and Displacement.
- The Multivariate Tests table shows the statistics of 4 separate multivariate tests (Wilk’s Lambda, Hotelling-Lawley Trace, Pillai's Trace, and Roy’s Largest Root). In this example, we can conclude that at the 0.05 significance level, the means are significantly different among 3 repair methods.
- The Means Comparisons table shows which means are different. In this example, for FailureLoad, the mean difference between method Meniscus Arrow and Vertical Suture, and also method FasT-Fix and Meniscus Arrow, are significant. For Displacement, the mean difference between method Meniscus Arrow and Vertical Suture, and also method FasT-Fix and Meniscus Arrow, are significant. For Stiffness, mean difference between method Meniscus Arrow and Vertical Suture is significant.
Two-way MANOVA
- Expand Project Explorer and select folder Two-way MANOVA. There is a workbook containing data from a cabbage field trial to study the yields from two different cultivars and multiple planting dates. The yields were evaluated using two response variables: weight of the cabbage head (col(“HeadWt”)), and ascorbic acid content (col(“VitC”)).
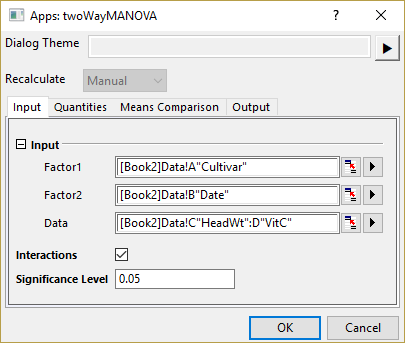
- Click second button on MANOVA toolbar to open the twoWayMANOVA dialog.
- On the Input tab, select col(“Cultivar”) for Factor1 and col(“Date”) for Factor2. Select col(“HeadWt”) and col(“VitC”) for Data. Check Interactions checkbox. Leave Significance Level to 0.05.
- Go to the Quantities tab. All quantities are checked by default.
- Go to the Means Comparison tab. Make sure Bonferroni method is selected to perform post-hoc pairwise comparisons.
Click OK.
- The report sheet MANOVA2Way from the Two-Way MANOVA analysis is added to the workbook.
Results Explanation
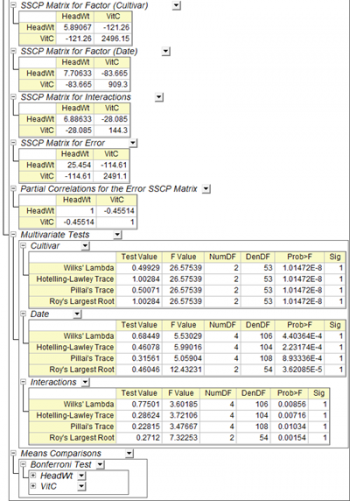
- The SSCP Matrix for Factor table represents the treatment sums of squares and cross products (SSCP), e.g., SSCP attributed to Cultivar, Date and Interactions. The diagonal elements are the univariate ANOVA sums of squares. The off-diagonal elements of this matrix are the cross products.
- The SSCP Matrix for Error table represents error sums of squares and cross products. The diagonal elements of this matrix are the univariate ANOVA error sums of squares for the response variables. The off-diagonal elements of this matrix are the cross products.
- The Partial Correlations for the Error SSCP Matrix table represents how strong the response variables are related. Lower value means the two response variables are less related. In this example, HeadWt and VitC are moderately related.
- The Multivariate Tests table shows the statistics of 4 separate multivariate test method. In this example, it concludes that at the 0.05 significance level, the means are significantly different among different Cultivars and Dates. Also, the interactions significantly affect responses, namely the effect on the responses of the change in Date depends on the type of Cultivar.
- The Means Comparisons table shows which means are different, particularly for Date and Interactions in this example.
|