2.9 Level CrossingLevel-Crossing
Summary
This Level Crossing app can be used to find X values at level crossings (a specific Y value), over a region of interest within a data plot.
Multiple data plots in the layer is also supported.
Tutorial
- Download Level_Crossing_App.zip zip file. Unzip the file, and open the workbook Sample Data.ogw in Origin.
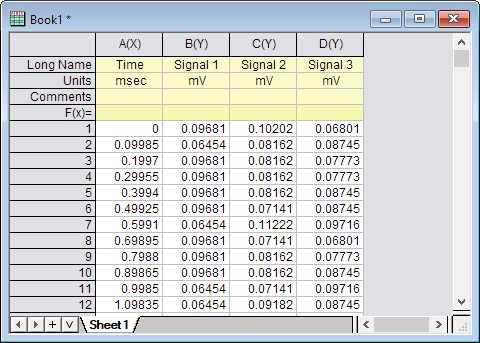
- Highlight Column B, C and D, then select Plot: Basic 2D: Line to create lines plot.
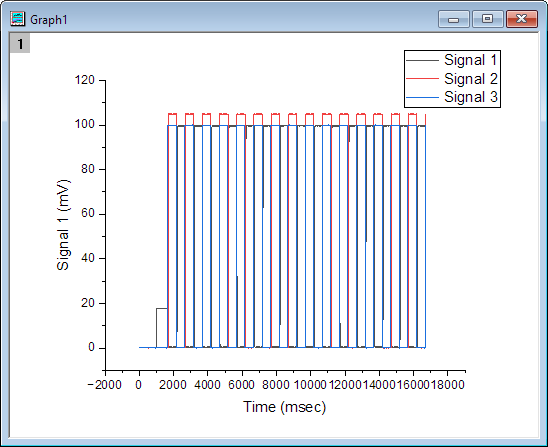
- Active the Line graph window, and then click on Level Crossing icon
 from the Apps panel. It will open the addtool_levelcrossing dialog. from the Apps panel. It will open the addtool_levelcrossing dialog.
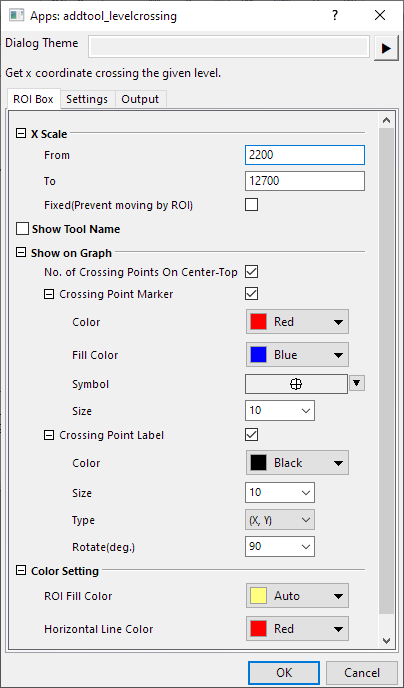
- Click OK button with default setting. You will see that a yellow rectangle (ROI box) and a horizontal red line are added to the plot.
- Resize the ROI box to cover all signals.
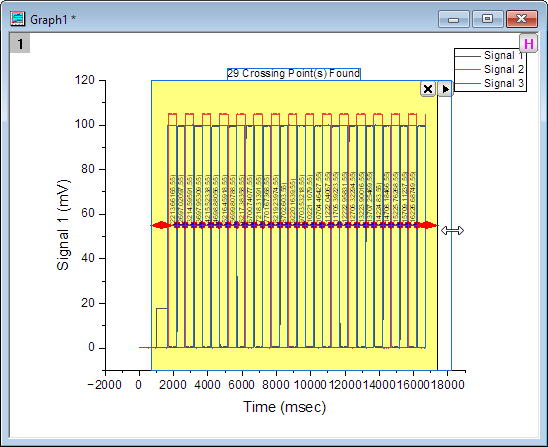
- Moving the horizontal red line can change the crossing level value.
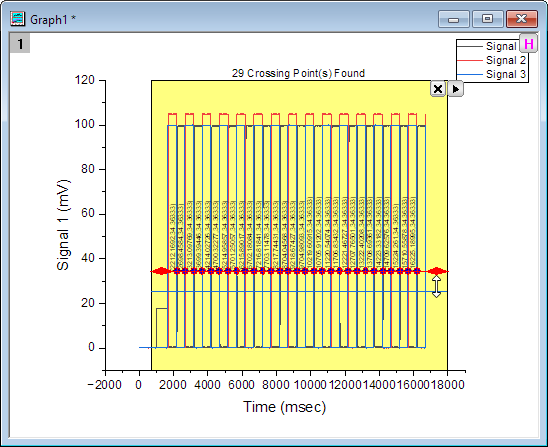
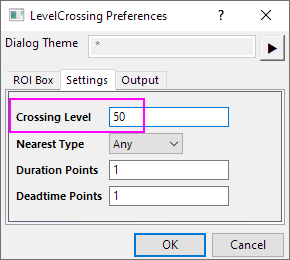
If you want to set a precise threshold, you can click the triangle button  and select Preference from the fly-out menu to reopen the dialog. Go to the Setting tab and enter 50 in Crossing Level box. and select Preference from the fly-out menu to reopen the dialog. Go to the Setting tab and enter 50 in Crossing Level box.
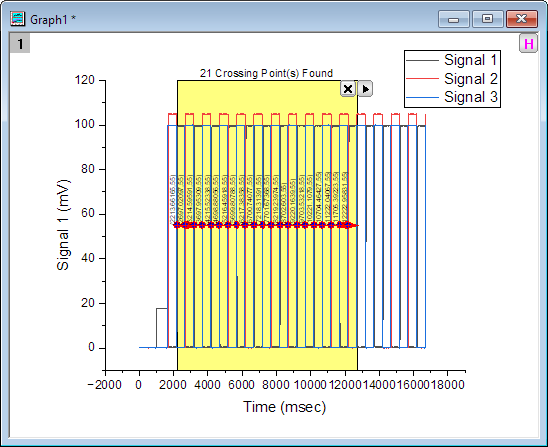
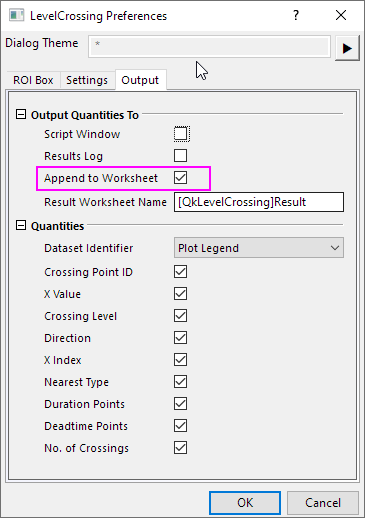
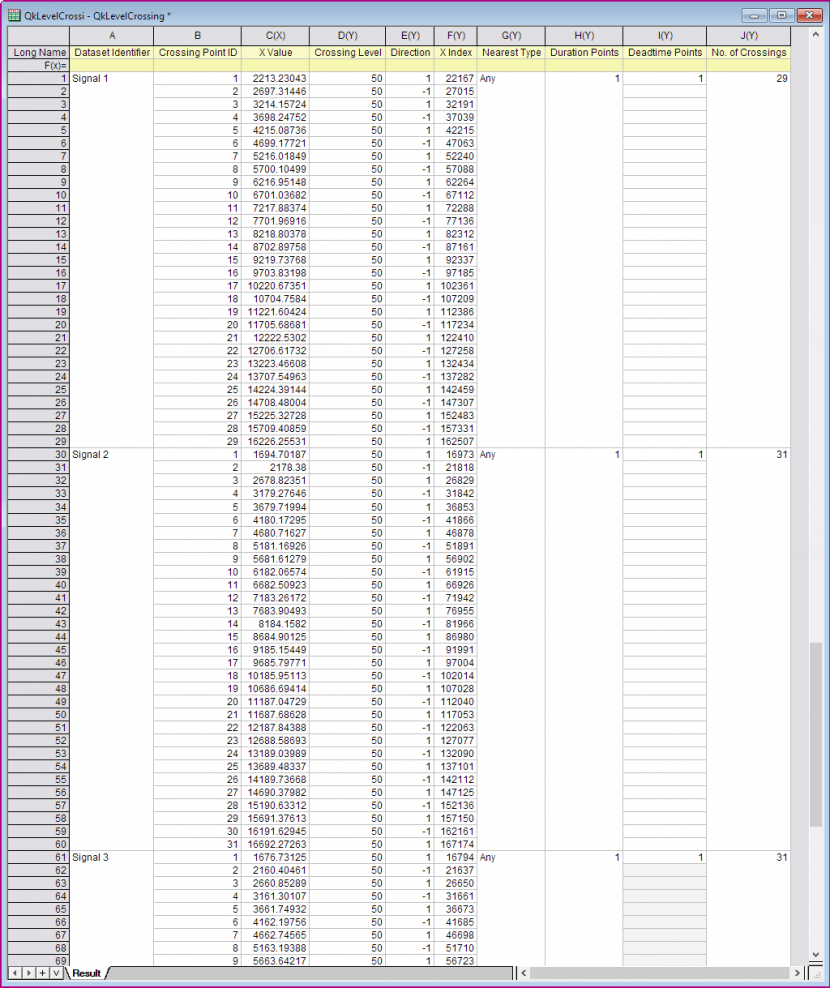
- Go to Output tab, uncheck Script Window and check Append to Worksheet.
- Click the triangle button again and select New Output for All Curves. Then the quantities of the crossing points for three plots will be output in a new workbook.
Dialog Settings
ROI Box Tab
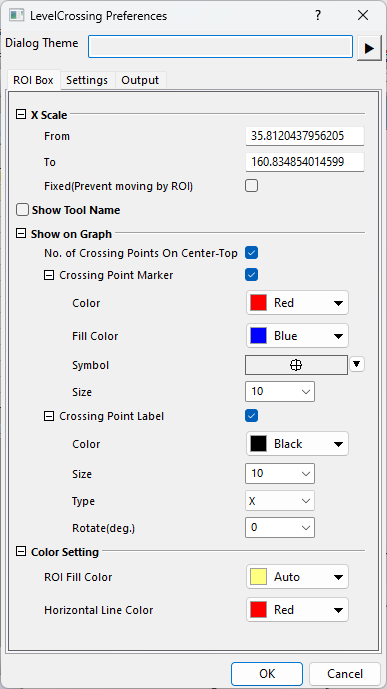
| X Scale
|
Define the position of ROI box by giving values for X coordinates.
- From
- The X coordinate for the leftmost line of the ROI box.
- To
- The X coordinate for the rightmost line of the ROI box.
- Fixed(Prevent moving by ROI)
- Specify whether to fix the position and size of the ROI box.
|
| Show Tool Name
|
Specify whether to show the tool's name near the top of the layer.
|
| Show on Graph
|
Specify what to show on the graph.
- No. of Crossing Points on Center-Top
- Specify whether to show how many crossing points found on center top of the ROI box.
- Crossing Point Marker
- Color: Set marker's edge color.
- Fill Color: Set marker's fill color.
- Symbol: Set marker symbol.
- Size: Set marker's size.
- Crossing Point Label
- Color: Set label color.
- Size: Set label size.
- Type: Set what to show as label, including three options, X, Y, and (X, Y).
- Rotate(deg.): Set rotate angle of the label, in unit of degree.
Note: If both X and Y coordinates are shown, it will show in the form of "(x, y)".
|
| Color Setting
|
Specify the displaying color.
- ROI Fill Color
- Specify the fill color for the ROI box.
- Horizontal Line Color
- Specify the color of the horizontal level line.
|
Settings Tab
| Crossing Level
|
Specify the Y value for the crossing level, so to find the X values at this level for the covered data curve in the ROI box.
|
| Nearest Type
|
Specify how to output the X index of the crossing point when the crossing point is interpolated but not the point of the original data.
Option list:
- Any
- The index of the point is closest to the crossing point.
- Left
- The index of the point is to the "left" side of the crossing point.
- Right
- The index of the point is to the "right" side of the crossing point.
|
| Duration Points
|
It is used to control the output of a pair of level crossing points. The distance (indices) of the pair of points should not be less than the specified duration, or both crossing points will be discarded. Only integer is acceptable.
|
| Deadtime Points
|
This variable is only available for version higher than Origin 2019b (not included). It determines how a level crossing point is treated as valid and output.
- The first found level crossing point will be treated as "valid".
- If other crossing points are found in the deadtime distance (indices) following the first point, they will be considered as "invalid" and thus ignored.
- If the next found crossing point is out of the deadtime distance (indices),
- If the point falls in the duration (indices) following the first point, both this point and the first will be considered as "invalid" and thus ignored.
- If the point locates out of the duration (indices) following the first point, this point will be considered as "valid" and output.
Only positive integer is acceptable.
|
Output Tab
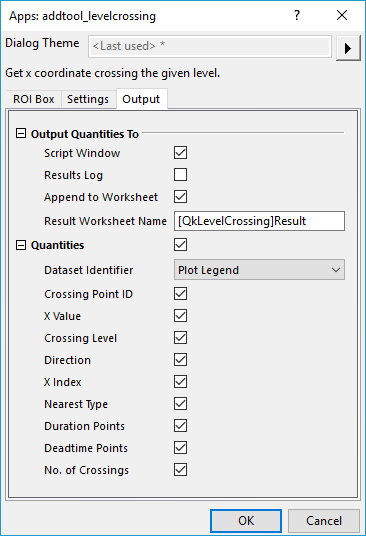
| Output Quantities To
|
Customize the output results
- Script Window
- Specify whether to output the results to Script Window.
- Results Log
- Specify whether to output the results to Results Log.
- Append to Worksheet
- Specify whether to append the results to a worksheet.
- Result Worksheet Name
- This is only available when Append to Worksheet is checked. It is used to specify the name of the worksheet.
|
| Quantities
|
Specify the quantities to be outputted.
- Crossing Point ID
- Specify whether to output the ID of crossing points.
- X Value
- Specify whether to output the X coordinates of the crossing point.
- Crossing Level
- Specify whether to output the Y coordinates (level) of the crossing point.
- Direction
- Specify whether to output the directions of the crossing behaviors, 1 for upward, -1 for downward, and 0 for differentiation is 0.
- X Index
- Specify whether to output the X indices of the crossing points.
- Nearest Type
- When the crossing point is interpolated but not the point of the original data, the output of X index of the crossing point can be the one closest to the crossing point (it is any), the one to the "left" side of the crossing point, or the one to the "right". This is used to specify whether to output these nearest type, any, left, and right.
- Duration Points
- Specify whether to output the variable used to control the output of a pair of level crossing points.
- Deadtime Points
- Specify whether to output the variable of deadtime points. This option is only available for version higher than Origin 2019b (not included).
- No. of Crossings
- Specify whether to output the number of crossing points.
|
Fly-out Menu
Click the button  at the upper-right corner of the layer to expand the fly-out menu, which includes the following options. at the upper-right corner of the layer to expand the fly-out menu, which includes the following options.
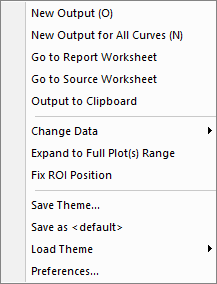
| New Output (O)
|
Output the results to the specified windows (Script Window or Results Log), and the specified worksheet (if not empty, append the results).
|
| New Output for All Curves (N)
|
Output the results for all plots in the layer.
|
| Go to Report Worksheet
|
Activate the report worksheet.
|
| Go to Source Worksheet
|
Activate the source data worksheet.
|
| Output to Clipboard
|
Specify whether to output Quantities result to clipboard
|
| Change Data
|
Select the source data set. This is applicable only when there are multiple curves on the graph.
|
| Expand to Full Plot(s) Range
|
Expand the ROI to cover the whole plot(s).
|
| Fix ROI Position
|
If checked, the ROI position is fixed and not allow to be moved around or change size.
|
| Save Theme
|
Save the settings as a theme.
|
| Save as <default>
|
Save the settings as default theme.
|
| Load Theme
|
Load theme settings.
|
| Preferences
|
Open the Level Crossing Preferences dialog.
|
|