3.139 FAQ-826 How to revert the new report table Results ± Errors to old report table Results and Errors in two columns on graph?How_to_revert_to_old_report_table
Last Update: 6/29/2018
In Origin 2016, Results ± Errors are shown as default in the report table after fitting, while Results and Errors are shown in two columns respectively in the previous version.
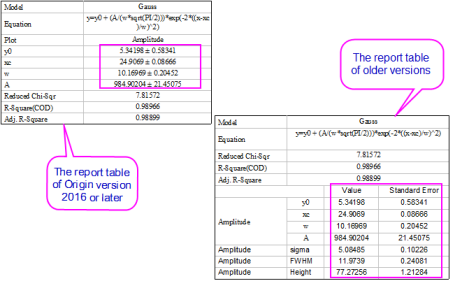
Sometimes, you might not prefer to show the plus-minus sign ± to connect fitted parameter values and their errors, then you can revert the new table back to the old one, to show the parameter values and errors in two columns.
To revert the new table back to the old one in an existing graph
Method 1:
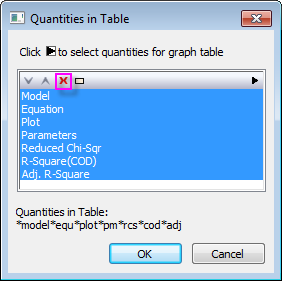
- Right click the new report table on the graph, and then select Quantities in Table… to open Quantities in Table dialog.
- Highlight all the items, and click Remove button.
- Click OK button, and roll back up to the old report table.
Method 2:
- Reopen the NLFit dialog, go to the Output sub-tab under the Settings tab, clear the Quantities in Table edit box to make it empty.
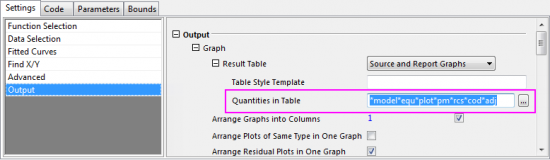
- Click Fit button to do the fitting again. Then, the old table will be back.
- Open the NLFit dialog newly, go to the Output sub-tab under the Settings tab, clear the Quantities in Table edit box.
- Click the arrow to the right of Dialog Theme and select Save as <default> to save this setting as default dialog theme of NLFit dialog.
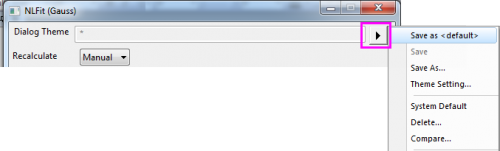
- In this way, this setting will work for all future fittings.
Keywords:report table, quantities in table, results, errors, old report table, separate values and errors, ± , remove plus-minus sign, show errors independently
|