3.31 FAQ-259 How to fit date and time data?Fit-Date-Time
Last Update: 9/26/2018
Experimental data is frequently a function of time, which may be expressed in units of calendar date (e.g. 4/1/2007). For calculations, Origin internally uses a Julian Day value, which is a large positive number such as 2.45419E6. Therefore, for experiments of normal duration, the internal Julian Day representation of the independent variable will consist of large numbers that differ only in the last one or two significant digits. Extensive calculations such as the Levenberg-Marquardt method in nonlinear fitting are unlikely to converge due to a loss of numerical precision.
To perform curve fitting, you can normalize the independent variables X to the earliest date. So a new independent variable X-prime is created such that X-prime = X - Date(earliest date) where Date is the Origin function for converting the calendar date to a Julian date. You can then perform the curve fitting operation using this new X column and your raw Y data column. Note that the results will then be based on the normalized X values. To plot the fit curve on top of the raw data you should add the offset back to the X column of the fit worksheet. Furthermore, the X column type should be set as Date in the case of time series data.
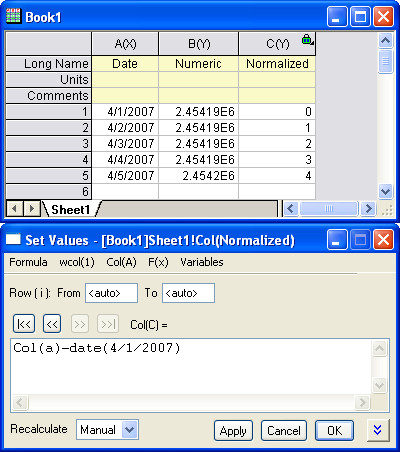
The example below illustrates how to use the Date() function in set column value dialog to create the normalized date dataset:
This normalization technique may be used whenever performing calculations with large positive numbers that differ only in the last one or two significant digits.
 | Note that beginning with Origin 2019, Origin supports a "2018" date system in which "time zero" is defined as January 1, 2018 at 00:00. Assuming contemporary dates, this date-time system is capable of significantly greater precision when dealing with fractional days (hours, minutes, seconds, etc.).
|
REFERENCES:
Keywords:Date, Time, Curve Fit, Fitting, Time Series, Normalization
|