|
|
|
|
|
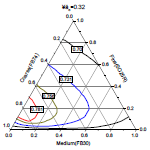
This ternary diagram displays the packing fraction when three particle types are combined. Each line in the graph represents a constant value for the packing fraction as a function of the fractional contribution of the three particles (course, fine, and medium) in the mixture.
Read
more... More of same type...
More by same keywords...
|