Back to Top
OriginLab Corporation - Data Analysis and Graphing Software - 2D graphs, 3D graphs, Contour Plots, Statistical Charts, Data Exploration, Statistics, Curve Fitting, Signal Processing, and Peak Analysis      
Buy Now Try Demo
Skip Navigation Links.

Polar Plot with Axes Set with Custom Grid Lines and Clockwise Orientation


Show more of same type...            Show more using same keywords...

Download this project to learn how to make the graph.


Description:

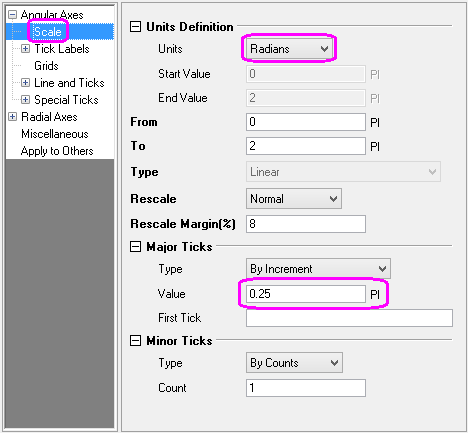
In the Axis Dialog, set angular axis scale unit to be Radians in Scale tab.

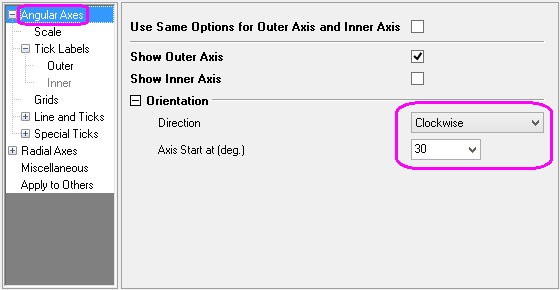
This polar graph has the angular axes set with a clockwise direction orientation. It also has an arbitrary zero position.

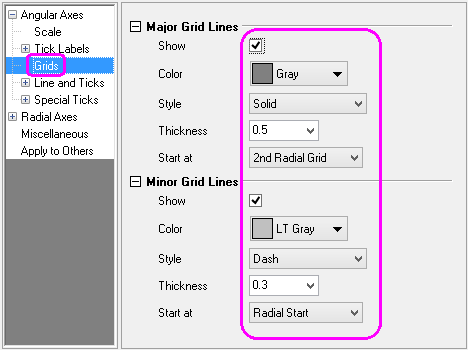
The major angular grid lines are set to start from the 2nd Radial Grid.

© OriginLab Corporation. All rights reserved.
× _ Let's Chat