This 3D scatter plot displays the House Price Index (HPI) vs. the number of houses for sale in US in the past 5 years.
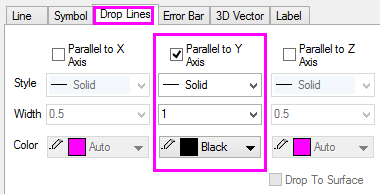
Drop lines parallel to the Y axis are turned on in the Plot Details dialog box, Drop Lines tab.

The blue line in the XZ plane is the projection of a more detailed dataset, plotted in 3D space with the symbols hidden.
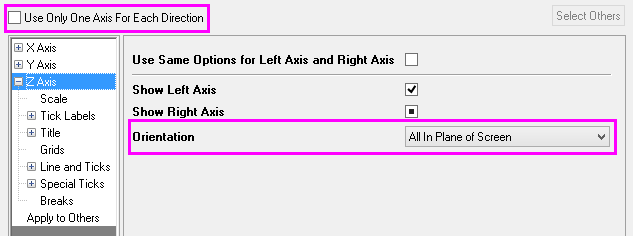
All axis ticks, labels and titles are oriented in the plane of the screen. The second Z Axis is turned on in the Axis Dialog box.
