17 Publishing and ExportPublishing-and-Export
The Master Page
The Master Page feature is used to add one or more common objects to exported or printed graphs. Use the master page to add a set of properties and objects -- a custom background, a company logo, text labels, images, etc. -- to selected graph windows in your project.
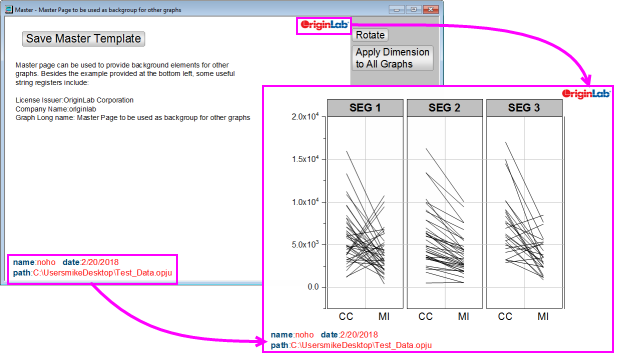
To make use of this feature, you must first create your Master Page. The Master Page should contain only the properties and objects that you want to display on your selected graph windows:
- From the menu, choose File: New: Master Page. If you are not in the project root folder when selecting this menu item, you will be asked to switch to the project root folder.
- Customize the Master Template. Note that the comments that show beneath the Save Master Template button are "hidden" and will not be applied to your graph windows.
- Click the Save Master Template button. When you save, the Master Template will be saved to the User Files Folder as "name of active window".otpu (e.g. "C:\Users\YourName\Documents\OriginLab\User Files\Master.otpu").
Things to know about the Master Page:
- Master items will only show in graphs pages of the same dimensions as the template. Apply Dimension to All Graphs applies Master Template page dimensions to all graphs of the same aspect ratio.
- If you create a graph and modify page size, then choose File: New: Master Page and load a Master Template into the workspace, the Master Template will be loaded with the page dimensions of your modified graph page.
- The Rotate button swaps the Master Template page dimensions (toggles orientation between landscape and portrait).
- When you click Apply Dimension to All Graphs you are prompted to apply dimensions only to graphs of the same aspect ratio, or to all graphs of the same orientation (portrait or landscape).
- Master Page items on a graph with portrait orientation will not show on a graph with landscape orientation and vice versa.
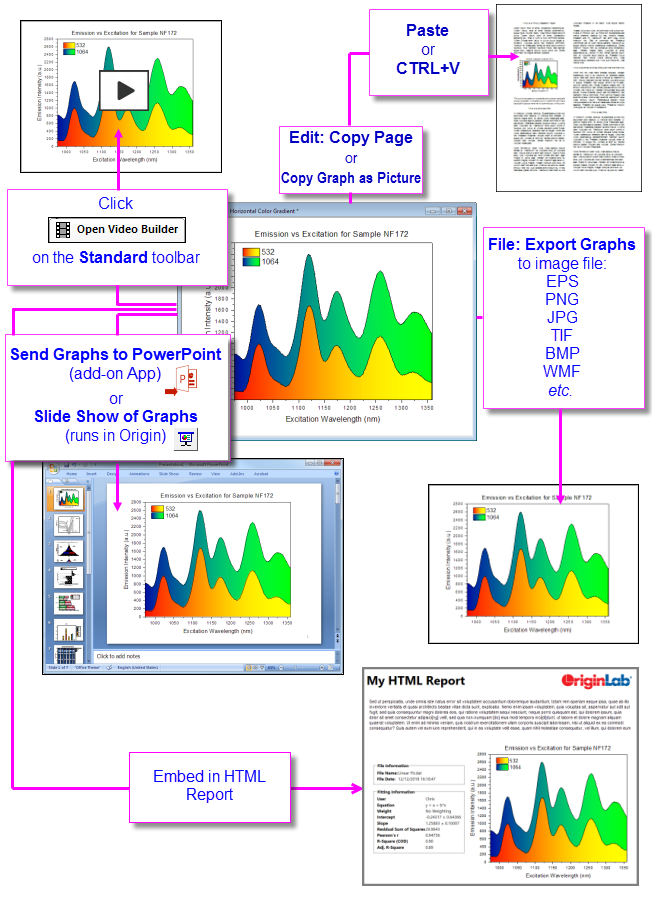
- When NOT using Master Items, Edit: Copy Page (CTRL + J) will place an OLE-editable Origin graph object on the Clipboard. When using Master Items, Edit: Copy Page will place an image on the Clipboard; the Copy Graph as Image dialog will open asking you to accept or adjust image settings before clicking Copy.
- If a graph uses Master Items, Send Graphs to PowerPoint does not support Insert Graphs as Embedded Object. Instead, use Insert Graphs as Picture which does support Master Items.
- There is a mechanism for selectively excluding Master Items in your exported or printed page. Any object that you do not want to appear in the exported or printed page should begin with "NoExport" (e.g. open an arrow object's Properties dialog and on the Programming tab, rename "Arrow" to "NoExport_Arrow").
- When you customize and save your Master Page to the User Files Folder, the next time you choose File: New: Master Page, you load your customized template.
- If you don't want to show Master Items in the workspace, click View: Show: Master Items and remove the check mark. The exported graph will still contain the Master Items (they just won't show in the workspace).
- If you want to remove Master Items from a graph in both the workspace and exported images, click Format: Page..., Display tab and clear the Use Master Items check box.
 | You could use the Text tool to add project and system information to your Master Template as static text objects, but since the idea is to build a template for re-use, consider "soft-coding" information in your text labels. To learn more, see these topics:
|
The Export Margin Offsets Dialog Box
By default, the margins of your copied or exported graph are determined by the Margin Control in Copy Page Settings group of Preferences: Options (Copy actions) or the Export Settings branch of Export Graphs (Export actions). You can interactively modify the default margins using the Export Margin Offsets Dialog Box.
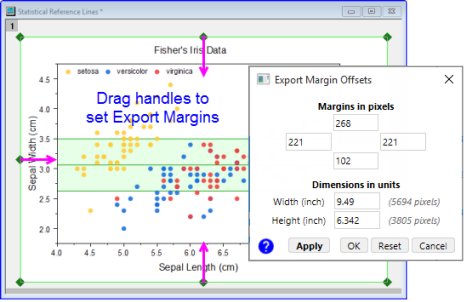
- Click on the graph window (to activate) and choose Edit: Set Export Margins. This opens the Export Margin Offsets dialog.
- Drag the blue selection handles that appear at the page margins; or enter values into the dialog edit boxes and click Apply.
Fit Page to Layer and Layer to Page
There are two small dialog boxes that are also helpful for removing white space or placing a margin around your graph before exporting:
- Fit Page to Layers: Choose Graph: Fit Page to Layers to open the pfit2l dialog box.
- Fit Layers to Page: Choose Graph: Fit Layers to Page to open the gfitp dialog box.
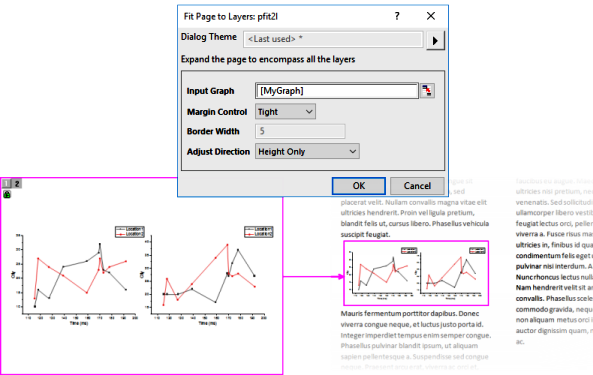
Both dialogs can be used to remove white space. Both can perform resizing, with or without changing graph aspect ratio. You can view the documentation for both to decide which might work best for you but basically it boils down to whether you need to keep a particular page size. If so, you'll likely want Fit Layers to Page; if not, either one may work for you.
Copying and Pasting Graphs to Other Applications
Graphs, Copy/Paste or Embedding
Copy/Paste Graphs
Embed Graphs, 3rd Party Applications
There are two ways you can include Origin graphs in another application's files (e.g. Microsoft Word .docx files):
- As an image
- As an editable OLE graph objectObject Linking and Embedding (OLE)
When you paste as an image, you are pasting a static object. In MS Word, for instance, you may be able to modify the image using Word's picture-editing tools, but you cannot make edits to the graph in Origin and have it update the graph in Word (short of deleting the existing image and replacing it with a new one).
By contrast, when you paste an editable OLE graph object you can later double-click on the object in the host application to launch a new instance of Origin. The graph and any associated data sheets will be available for editing. After editing, use Origin's File: Exit and Return to... menu item to update the embedded object, close Origin and return to the host application.
Copy Graph as Image
- Click on your Origin graph to activate it, then ...
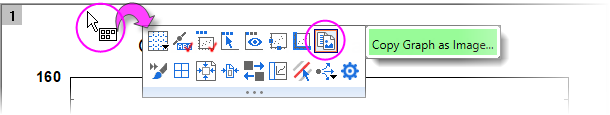
- Choose Edit: Copy Graph as Image (CTRL+ALT+J). Alternately, click on the graph window near the page margin and click the Copy Graph as Image button on the Mini Toolbar.
- In your host application choose Paste or press CTRL+V.
When copying the graph as an image (CTRL+ALT+J), you have a choice of image formats (PNG, EMF, DIB, HTML, JPG). Additionally, you can make quick size adjustments and specify background transparency (PNG). The Copy Graph as Image (copyimg) dialog includes a Dialog Theme control which allows repeating <Last used> settings, saving current settings as default Save as <default> or saving settings to a named Theme (Save As...).
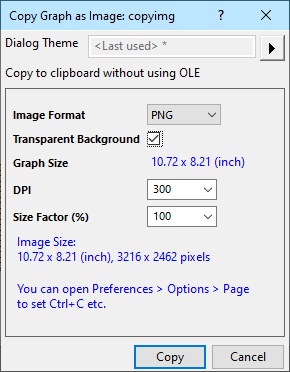
| There is a Copy control on the Preferences: Options: Page tab that lets you assign the CTRL+C hotkey combination to either Copy Graph as Image <last used> or Copy Page (CTRL+J) (i.e. "editable OLE graph object"). This allows you to bypass the Copy Graph as Image dialog and speed up placing a standardized image on the Clipboard using CTRL+C.
|
Copy Graph as Editable OLE Graph Object
- Choose Edit: Copy Page (CTRL+J).
- In your host application choose Paste or press CTRL+V.
Organizing Your Graphs for Presentation or Export
If your Origin project file contains a large number of graphs that you plan to export or use in an Origin slide show, you can make things easier by adding shortcuts to your graphs to a Project Explorer Favorites folder and arranging them there:
- Right-click on a window and choose Add Shortcuts to Favorites. This will add a shortcut to each graph window, to a new Favorites subfolder (visible in Project Explorer).
- When sending graphs to PowerPoint or creating an Origin slideshow, you can (1) set slide order in the corresponding dialog box or (2) set slide order following this procedure.
The Layout Page
A layout page, as the name implies, is a window useful for laying out different elements for publication or export. Use it to assemble graphs, result tables, text objects, etc. onto a single panel.
Typically, you start by creating a blank panel:
- Click the New Layout button on the Standard toolbar.
- Right-click on the blank layout to paste Clipboard content, add text, insert images from files, add graphs, tables, etc.
- When inserting an image from file, right-click in the area where you want to insert. When adding graphs or worksheets, pick a window in the Browser and drag out an area on the layout with your mouse. Note that added objects can be moved or resized by dragging with your mouse.
- You can make edits to inserted images, by double-clicking on the image. This opens the image in the Image Window.
- You can make edits to the graph by double-clicking on the inserted graph object. This opens the source graph for editing. Edits to the source graph will update the graph on the layout page.
- Inserted tables can be edited by double-clicking on the table object. Style adjustments can be made by selecting a table object and using available Mini Toolbar buttons.
- Note that selected elements on the layout page can be aligned using Object Edit toolbar buttons.

| Exporting of layout pages to .SVG files is supported. When adding graphs to the layout, choose Add Graph from the layout shortcut menu and elements of your SVG file (e.g. text) will be editable in applications such as Inkscape or Adobe Illustrator.
|
For more on the layout page, see Using the Layout Page Window in the Origin Help file.
Merge Graphs to Layout
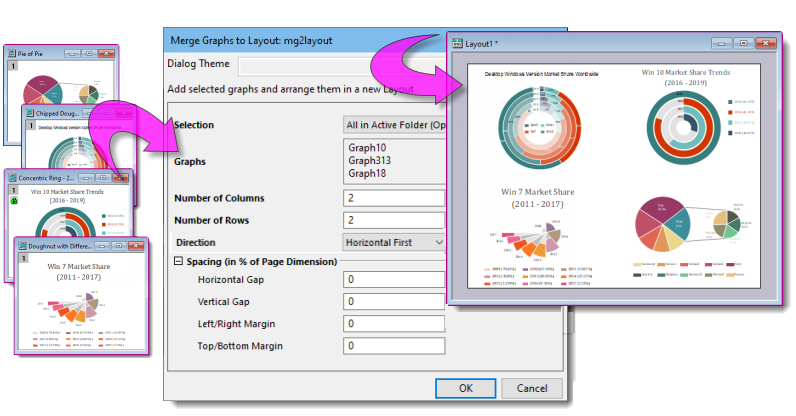
As an alternative to manually creating layouts, Origin offers a tool that will merge select graphs into a single layout page of equal spacing. In this case, merged graphs are images and, therefore, not editable using the procedure described in step #3 of the previous section. However, if further graph edits are not needed, you can use this method to quickly produce a nice-looking layout.
To merge graph images into a single layout:
- With a graph window active, click Graph: Merge Graph to Layout: Open Dialog.
- Use the Selection drop-down to specify how to select graphs. To choose individual graphs, choose Specified and use the browse button beside Graphs to open the Graph Browser and pick graphs.
| Use the Fit Page to Objects menu command (Format: Fit Page to Objects) to apply a uniform margin to the active Layout page. This works the same as the aforementioned Fit Page to Layers does for graph windows.
|
Exporting Graphs and Layout Pages to an Image File
Graphs, ExportingExporting Graphs/Layout Pages
Layout Pages, Exporting
Origin 2021b added a simplified graph export routine to complement the existing graph export routine:
- File: Export Graph: If you simply want to export one or two graphs to one of several common image format (PNG, BMP, JPEG, TIFF, EMF) and need only minimal control of image size, this routine is quick and easy.
- File: Export Graphs (Advanced): If you want to batch export graphs (e.g. All in Active Folder, All in Project, etc.), or export to vector types such as PDF or EPS, use this routine. The dialog supports outputting to a specified path, auto naming, application of Speed Mode settings to exported graphs, plus margin control, image size and other filetype-specific settings.
| Beginning with Origin 2023, the following export dialogs will add a date-time stamped clickable link to the Messages Log. Click the link to open the file using an internal Origin viewer (see below):
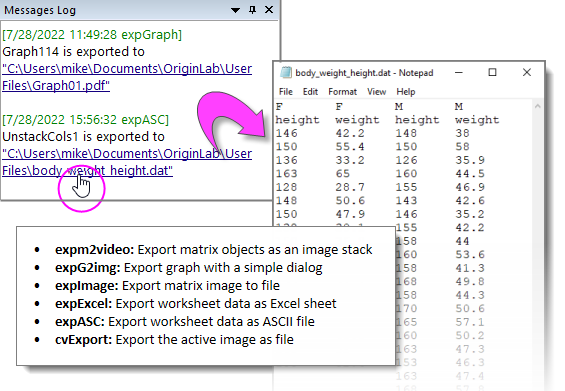
In addition, two system variables are added to manage Messages Log output for images:
- @VID is added to select image viewer (raster, EMF): 1 = use Origin viewer (default); 0 = use system default application.
- @MSG is added to control what is output to the Messages Log: 0 = output both file and and link (default); 1 = output link only; -1 = disable message output.
To open file location in Windows Explorer (without opening the file):
- Right-click on a link and choose Open File Location; or press Ctrl while clicking on the link.
|
File: Export Graph
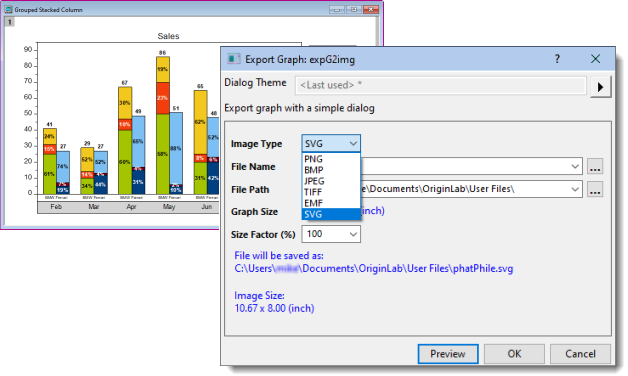
File: Export Graph (X-Function = expG2img) is a simplified routine for exporting the active graph page to one of the following formats: PNG, BMP, JPEG, TIFF, or EMF. It does not offer the level of control or flexibility as File: Export Graphs (Advanced) (next section) but it works well for simple export of individual graph pages.
To export a graph or layout page to raster image using the simplified expG2img dialog:
- When a graph window is active, choose File: Export Graph.
- For EMF images, set a size factor relative to the Image Size reported at the bottom of the dialog. For raster formats, choose an output DPI setting. Alternately, clear the Auto check box and specify a Width in Pixels. Clicking Preview opens the graph-to-export in an internal viewer.
File: Export Graphs (Advanced)
File: Export Graphs (Advanced) (X-Function = expGraph) is Origin's primary tool for exporting graphs and layout pages. It supports raster or vector output, flexible multi-page export (e.g. All in Active Folder), DPI and Speed Mode control and more.
To export a graph or a layout page as an image file:
- Select the menu File:Export Graphs (Advanced).
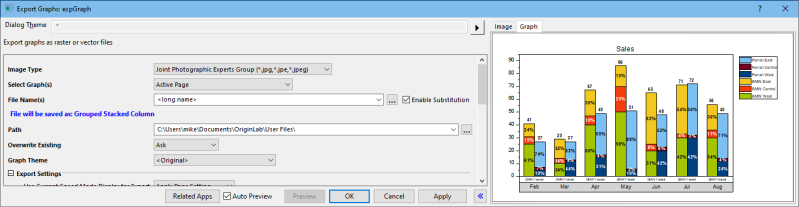
The expGraph routine exports graphs to one of 15 file formats:
| Raster Formats
|
BMP, GIF, JPG, PCX, PNG, TGA, PSD, TIF;
| When you select Image Type = TIF/TIFF, and select multiple graphs for export (e.g. All in Active Folder), an Export as multi-frame TIF check box is added to the dialog. Check the box to export selected graph windows to a single TIF image (TIF stack).
|
|
| Vector Formats
|
CGM, DXF, EPS, EMF, PDF, SVG, WMF
|
Saving Export Settings to a Theme
As is the case with many other Origin dialog boxes, you can save your graph export settings as a Dialog Theme for repeat use.
Once you have determined your export settings:
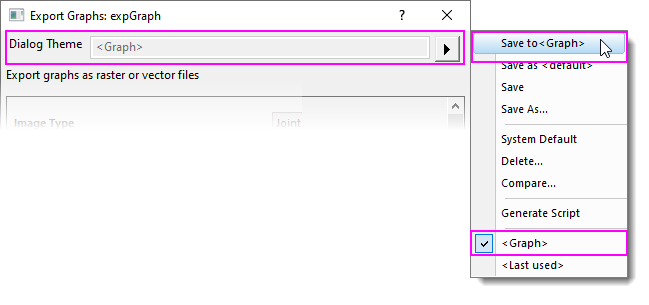
- Click the flyout button to the right of Dialog Theme and choose one of the Theme save options.
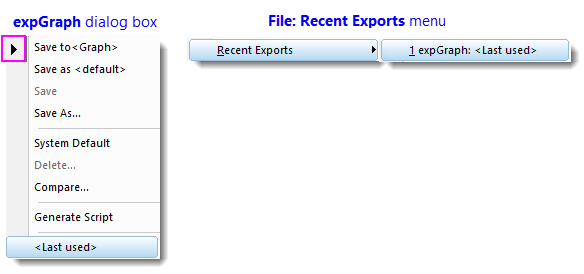
- Using any group of custom settings creates a temporary default Theme called <Last used>. This Theme then becomes available for loading your last used settings and you can access it from the expG2img or ''expGraph dialog boxes or from the File: Recent Exports menu.
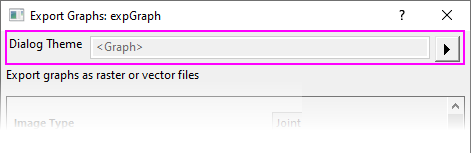
Since Origin 2021, expGraph dialog box settings are saved to the graph automatically on export.
- To save current settings withtout exporting, choose Save to <Graph>.
- To restore saved settings after you've modified them in the export dialog, choose <Graph>
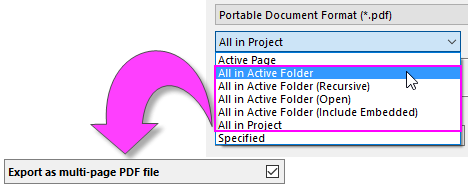
| You can export multiple graphs, such as all graphs in a folder or all graphs in a project file, to a single, multi-page PDF file. Choose File: Export Graphs and open the Export Graphs dialog box. Set Image Type to Portable Document Format (*.pdf) and Select Graph(s) to one of the following options and you will see a checkbox for Export as multi-page PDF file.
|
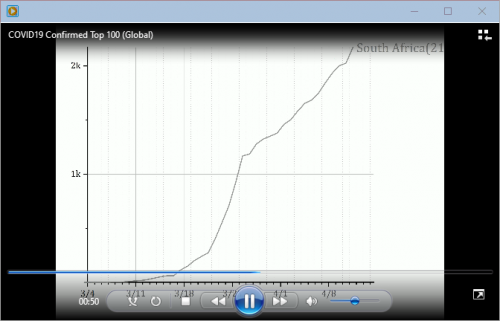
Exporting Browser Graphs to Video
To export a Browser Graph as a video (GIF, TIFF, AVI):
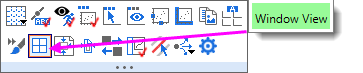
- Activate the Browser Graph. Before going further, confirm that the graph is in Page View (click just below the window title bar and when the Mini Toolbar appears, verify that there is NOT a red check mark beside the Window View button. If there is, clear it).
- In the panel to the left, click the menu button
 and choose Flip Through. and choose Flip Through.
- Click the Export button and set File Type = GIF, TIFF or AVI.
- Modify other settings as needed and click OK. Unless it has been turned off, export will dump a clickable link to the Messages Log. Click the link to run the video in the supporting application.
Exporting Images to a Raster or Video File
Using File: Export Image (X-Function = cvExport) Image window you can export images to one of several raster formats: BMP, GIF, JPG, PNG, TIF.
To export an (image window) image using cvExport:
- With the image window active, choose File: Export Image.
- Choose from the list of raster images; or save as a video file (*.avi).
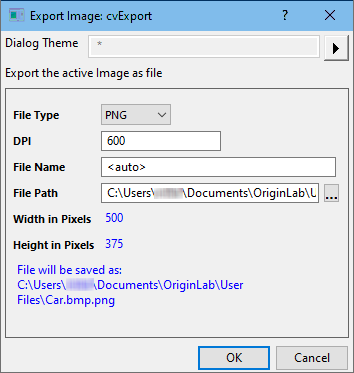
After exporting, a clickable link will be generated in the Messages Log.
Exporting Matrices
Export Matrix as ASCII
This will create an ASCII file of the data contained in the active matrix object.
- With the matrix active, choose File: Export: ASCII.
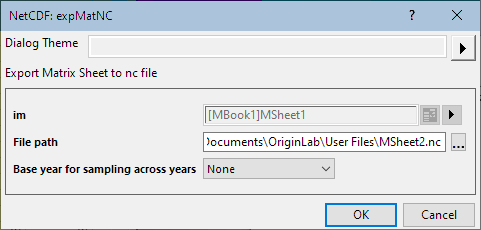
Export Matrix as NetCDF
This will export all objects in the active matrix to a .nc file:
- With the matrix active, choose File: Export: NetCDF.
- For Base year for sampling across years, note that when the matrix data are averaged across years, the time variable is not exported with the NetCDF file. Use this to specify how to indicate time:
| None
|
Do not specify a time variable
|
| Use Starting Year
|
Use starting year as time variable
|
| Use Ending Year
|
Use ending year as time variable
|
For more information on Exporting NetCDF data, see the Origin Help file.
Export Matrix as Image
Matrix images can be exported using File: Export: Image (X-Function = expImage).
To export a matrix image to raster file including as Grayscale GeoTIFF:
- With the matrix active, choose File: Export: Image.
- Verify that the File Type is correct. For GeoTIFF data, the TIF/TIFF format should be pre-selected but to export as grayscale GeoTIFF, check the Export as Grayscale GeoTIFF box.

After exporting, a clickable link of exported file path will be generated in the Messages Log.
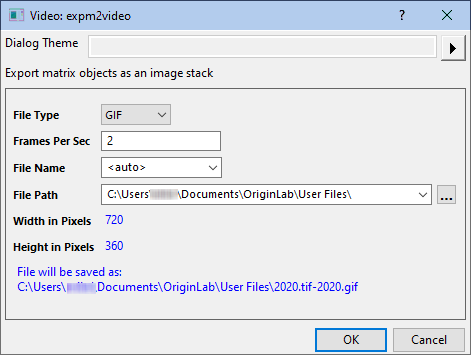
Export Matrix as Video
Matrices containing multiple matrix objects can be exported to GIF, TIF and AVI (X-Function = expm2video).
To export a series of matrix objects as a video file:
- With the matrix active, choose File: Export: Video.
Exporting Worksheets
Worksheets, Exporting
Exporting Worksheets
With a worksheet active, the File: Export menu item provides the following options:
As ASCII, NI TDM (TDM, TDMS), and Sound (WAV)
These apply only to sheets containing data columns, and are not available for analysis report sheets (see other options, below). The exported file will contain only data from the worksheet columns. Floating or embedded graphs placed in the worksheet will be ignored.
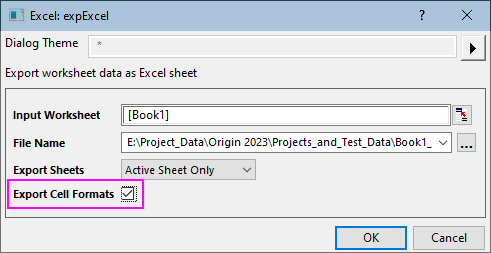
As Excel
Export books of worksheet columns with text and numeric data to an MS Excel file (XLS, XSLX, XSLM). Note that analysis report sheets with their hierarchical tables, and things such as embedded graphs and images, are not exported to the Excel file. Analysis results that are output to regular Origin worksheets are exported.
- With the worksheet active, choose File: Export: Excel.
- In the dialog that opens, set Export Sheets to Whole Book or Active Sheet Only.
- Optionally, check the Export Cell Formats box to export numeric and style formats (decimal digits, font, background color, etc.).
As SQLite
This option exports the active worksheet(s) as an SQLite file. Specify a file extension of .sqlite, .sqlite3 or .db (note that file structure is identical). Options to skip hidden columns or rows. Limited to export of data in worksheet columns.
As Multipage PDF File
This option is available only on sheets with data columns, and not for analysis report sheets. Use the View: Page Break Preview Lines menu item to view the vertical and horizontal page break lines that determine which columns and rows will be included in each page of the export. Floating or embedded graphs placed in the worksheet will be included in the exported image.
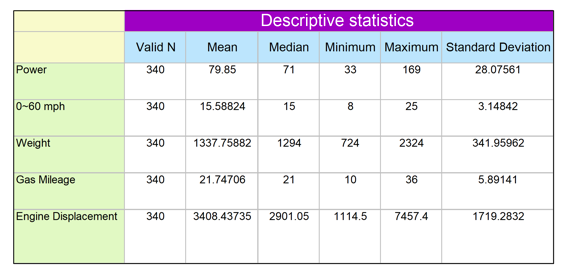
As Image File
This option is available on both data and analysis report sheets:
- With the worksheet active, choose File: Export: As Image File.
- In the dialog that opens,
- Image file formats including PDF and SVG are supported.
- Floating or embedded graphs placed in the worksheet will be included in the exported image.
- Set Export Area to Visible, Whole or Selection. Note that empty rows no longer exported when Export Area = Whole.
- Border is added to exported worksheet by default. Change border width or remove border, set the Frame Thickness drop-down.
As PDF File
This option is available for both data and analysis report sheets. In the dialog that opens, you can opt for exporting the entire sheet, the visible area, or a selection. Floating or embedded graphs are included in the exported PDF.
| When creating a custom report from a worksheet that combines data, numeric results and graphs, the best option is to export the entire sheet as a PDF file, or export the sheet as a multi-page PDF file.
|
Send Graphs to PowerPoint
Graphs, Send to PowerPoint
PowerPoint, Exporting to
You can send a group of Origin graphs to MS PowerPoint as pictures or as embedded objects (see limitations of embedded objects and Master Items, explained above). Graphs inserted as embedded objects can be further edited in your Origin software. Double-click on the graph in PowerPoint to open the graph in an OLE instance of Origin.
To Send Graphs to PowerPoint:
- Click the Send Graphs to PowerPoint button
 on the Standard toolbar. on the Standard toolbar.
or...
- Click the Send Graphs to PowerPoint icon
 in the Apps Gallery, docked to the right-side or your Origin workspace (if you do not see the Apps Gallery, click View: Apps or press ALT + 9). in the Apps Gallery, docked to the right-side or your Origin workspace (if you do not see the Apps Gallery, click View: Apps or press ALT + 9).
or...
- Right-click in the lower-pane of Project Explorer and choose Send Graphs to PowerPoint.
Slide Show of Graphs
Graphs, Slide Show
Slide Show of Graphs
Origin has a built-in slideshow utility for viewing or presenting your graphs while running Origin. The slide show can be started in two ways:
- Right-click on any folder in Project Explorer and select Slide Show of Graphs...
or
- Click the Slide Show of Graphs button
 on the Standard toolbar. on the Standard toolbar.
A dialog box opens offering options to set slide order, slide cycle time, whether to include graphs in sub folders, etc. The dialog also lists shortcut keys for use during the slide show (e.g. G = go to the actual graph window of the currently displayed slide).

|
Tutorial: Slide Show of Graphs
- Use the File: Open Sample Projects: 2D and Contour Graphs menu to open the sample project.
- Click on the Slide Show of Graphs button in the Standard Toolbar.
- Accept default settings in the dialog that opens, and press OK to start the slide show.
- You can use the up/down arrow keys or the mouse wheel to flip thru the slides.
|
Creating Movies
Graphs, Animating
Animating Graphs
Movies, Animating Graphs
Video Builder
Origin provides a Video Builder tool, accessible from the Open Video Builder button  on the Standard Toolbar. This tool can be used to manually capture a series of graph windows, and write one frame at a time to a video (.AVI) file. on the Standard Toolbar. This tool can be used to manually capture a series of graph windows, and write one frame at a time to a video (.AVI) file.
Videos can be created using LabTalk script or Origin C code, by programmatically computing or updating data and then writing out the graph as a frame in the video, at each step during the computation.
| Note: For more information, please refer to the:
Help: Origin: Origin Help > Exporting and Publishing Graphs > Creating Graph Animation
|
| For specific examples of programmatically created movies, including Origin Projects and code, please visit www.originlab.com/animation.
|
Notes Windows for Reporting
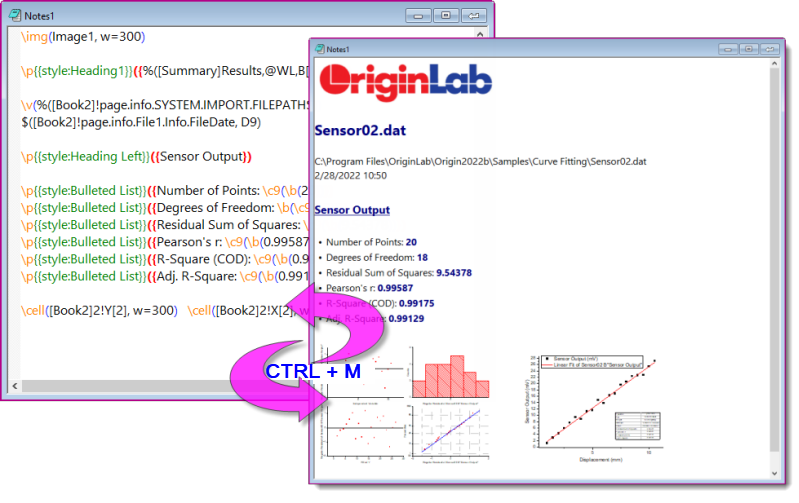
Over time, Origin's Notes window has morphed from a plain-text window for jotting down your research notes, into a flexible medium for collating a variety of research-related materials.
Because the Notes window can contain linked objects -- graphs, images, worksheet cell values, etc. -- it can be useful to add a Notes window to an Analysis Template™ for purposes of summarizing analysis results. Alternately, you can save your Notes window as a PDF by clicking File: Print and choosing a PDF driver.
Notes Window Syntax
Origin's Notes window supports four syntaxes: Text, Origin Rich Text (default), HTML, and Markdown.
- To switch syntaxes, choose Notes: Syntax: Text.
- Once you have selected Text, you can freely choose other syntaxes from the Notes menu.
Rich Text
With Rich Text, the Notes window has two modes -- raw text mode and Render mode. Toggle between these modes using Notes: Render Mode or shortcut key combination CTRL + M.
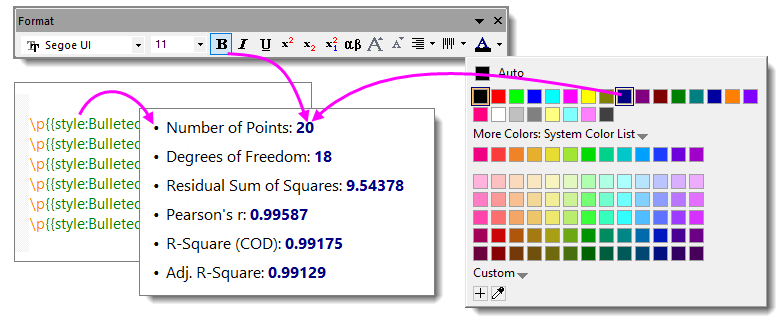
To add text to the Notes window, you need to be in raw text mode. To style added text, use the Format toolbar and/or apply pre-defined paragraph styles.
Adding Content to Your Notes
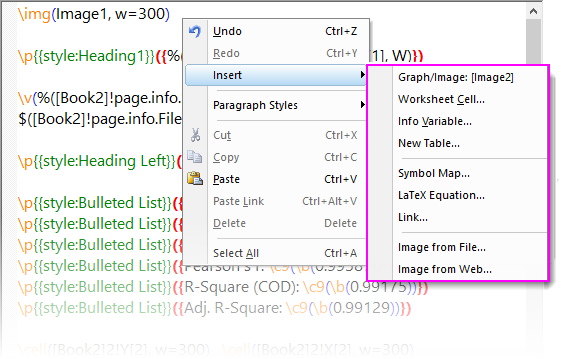
You can insert these objects to the Notes window by by right-clicking in the Notes window and choosing from the shortcut menu:
| Object
|
Comments
|
| Graph/Image
|
Opens the Graph/Image Browser where you can pick project graphs and images. Note that you can Show Embedded Graph (see the first row of this table for a definition of "embedded graph") and Project Explorer "Favorites" folder shortcuts (Include Shortcut Page).
|
| Worksheet Cell...
|
Opens the interactive range selector. Use this to pick a cell value in a worksheet or report sheet. Click Done to insert a linked cell value.
|
| Info Variable...
|
Opens the Insert Variables dialog for inserting project variables stored on data import.
|
| New Table
|
Opens the New Table dialog for configuring a basic table. Clicking OK closes the dialog and opens a basic workbook containing a single worksheet. Customize the worksheet, add data, etc., then use Notes window Render Mode to view the resulting table.
|
| Symbol Map
|
Opens a simplified Symbol Map with characters sorted by tab. Click Advanced to go to the full Symbol Map.
|
| LaTeX Equation
|
Opens the LaTeX Equation Editor App (if you've not already installed this free App, you are prompted to do so). You can click the Equation button  to open a list of Origin's fitting functions (incl. your user-defined functions). Pick a function (or enter a function into the top box) and click Preview to see your equation rendered. to open a list of Origin's fitting functions (incl. your user-defined functions). Pick a function (or enter a function into the top box) and click Preview to see your equation rendered.
|
| Link
|
Opens a dialog box for entering Text to display and a Link. The link can be a URL or it can be a link to such things as a worksheet data range (e.g. range://[book1]sheet1!col(1)[100]). Additionally, you can run simple LabTalk commands using a "labtalk://" tag (e.g. labtalk://newsheet).
|
| Image from File
|
Opens a dialog to browse for image files. Note that the inserted image is linked to an external file and is not saved with the project.
|
| Image form Web
|
Opens a dialog to specify a Image Link for a web image (hint: In your browser, right-click on an image and Copy Image Address, Copy Image Link, etc).
|
- Add your content using raw text mode.
- When you are ready to view your content, turn on (place a check mark beside) Notes: Render Mode or press CTRL + M. Note that you can use the Zoom combo box
 on the Standard toolbar to zoom in or out on the page (CTRL + mouse wheel also works). on the Standard toolbar to zoom in or out on the page (CTRL + mouse wheel also works).
Text Styles Manager
In addition to styling text with the Format toolbar, you can apply a simple set of paragraph styles on a line-by-line basis. Manage styles with the Text Styles Manager dialog box.
- With a worksheet active, choose Tools: Text Styles Manager.
- Select a Style to Modify and Apply or Close.
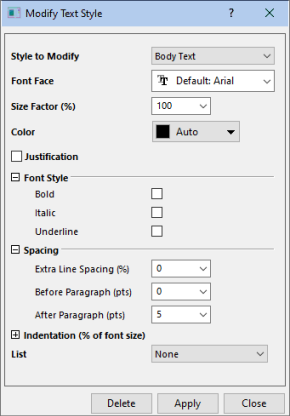
Note that you can add styles by selecting <new> from the Styles to Modify drop-down list; or select a style and Delete.
To apply a paragraph style to Notes window text:
- Open the cell note in a Notes window.
- With Render Mode off (CTRL + M, to toggle), click on a line of text then right-click, choose Paragraph Styles and choose a style from the popup menu.
- To check results, press CTRL + M (Render Mode).
| To see a list of built-in paragraph styles, open a fresh Notes window, then from the menu choose Notes: Load Samples: Built-in Styles.txt.
|
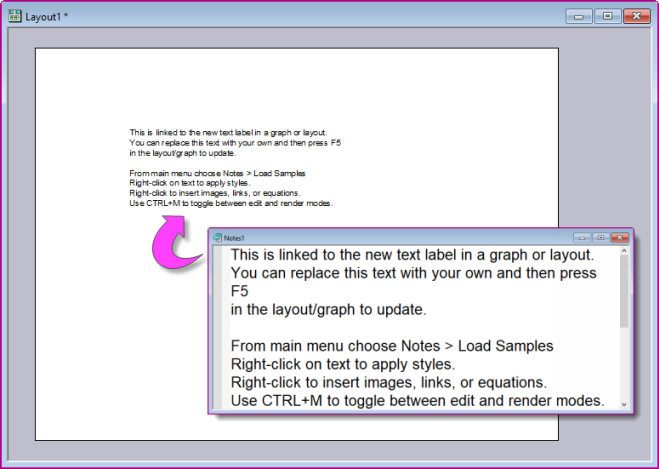
Adding Rich Text Content to Layout or Graph
You can insert Rich Text content from a Notes window to a text object on a Layout or graph page.
To add the content of an existing Note (Layout or Graph):
- Select the Text tool
 , then click on the Layout/Graph and enter "@@@NotesN" (i.e. the Notes window Short Name). , then click on the Layout/Graph and enter "@@@NotesN" (i.e. the Notes window Short Name).
- Click off the text object to insert Notes content.
To add content by creating a new Note (Layout only):
- Right-click on the Layout and choose Insert Notes Text.
- See Adding Content to Your Notes.
Print or Export to PDF
You can output Rich Text content to a physical printer; or print to PDF using a third-party driver such as Microsoft Print to PDF.
To create nice-looking output, you'll need to pay attention to these settings:
- Paper Size: This is set in File: Page Setup or in the Advanced options for your printer driver.
- Margins: These are set in File: Page Setup.
- Notes Display Margin: By default, the Notes display margin = 5 (units = points). Thus, you will note that in Render Mode (CTRL + M), there is a slight margin to the left side of the Notes page. This display margin is controlled by setting system variable @NDM.
- Notes Window Page Width: Page width is controlled by the property
note.width (units = in/cm, etc). Default = 0, which corresponds to an uncontrolled width.
- When width is uncontrolled (
note.width = 0), Notes Window Page Width is approximately equal to Paper Size – Margins. This should produce a satisfactory printout to PDF or paper.
- If you do specify
note.width, do not exceed Paper Size – Margins or your text may be cut off.
HTML and Markdown
You can also use Notes windows to create HTML or Markdown reports. Similar to Rich Text, you can build your HTML report using placeholders that link to report sheet elements such as metadata, statistical results or graphs. The resulting HTML report can be printed or exported; or it can be incorporated into your Analysis Template. If Markdown syntax is used, optional HTML syntax can be also included for advanced customization.
To use this feature, the user should have some basic familiarity with HTML or Markdown, and as with most things, the more proficient the user is, the easier it will be to create professional-looking output. However, the skill needed to generate a basic report can be easily mastered. See this OriginLab blog post for guidance.
Adding Content to Your HTML Report
The basic steps of creating reports using an Origin Notes window, are as follows:
- Create your project to include graphing and analysis results.
- Click the New Notes button
 to add a Notes window. to add a Notes window.
- From the menu, choose Notes: Syntax, then choose HTML or Markdown (Hint: You can toggle between text/view and markup modes by pressing CTRL+M and you can choose the default syntax by setting LabTalk System Variable @NPS).
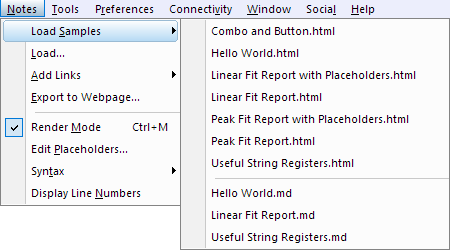
- You can write your code in the Notes window's markup mode or you can use a text editor such as Notepad++, then copy and paste it to your Notes window. If you have no experience with HTML or Markdown, you may want to load samples by activating your Notes window and clicking Notes: Load Samples (HTML = ".html", Markdown = ".md").
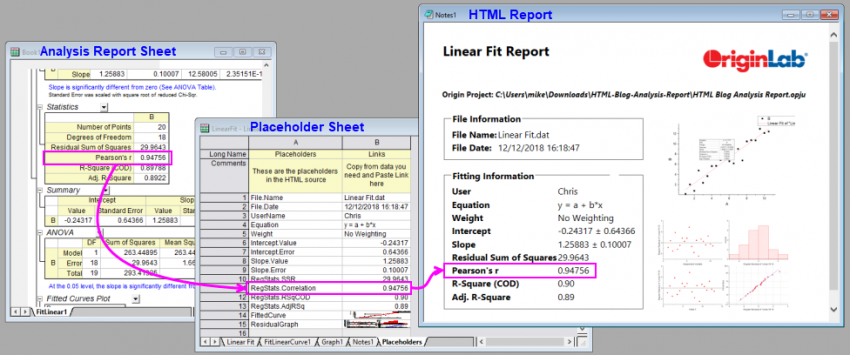
- You will likely want to incorporate graphing and analysis results from the current project, into your report. The simplest way to do this is to insert "placeholders" for each Origin object that you intend to include in your report, into your code. These placeholders can be named using any string that makes sense to you and they should be enclosed in double-curly braces (e.g.
{{MyR-SquareValue}}).
- Right-click on the Notes window title bar and choose Edit Placeholders. Placeholders that you have incorporated into your code will be picked up and added to a Placeholders worksheet in the workbook. The sheet will list, in column A, all of the placeholders found in your code. A second column -- Column B -- is blank and is reserved for adding the associated Origin objects (i.e. the variables, analysis and graphing results, etc.) that you want to include in your report.
- For each placeholder in column A, find the associated Origin object and copy it to the Clipboard (e.g. if it is a numeric quantity in a sheet resulting from some statistical analysis, select the cell quantity, right-click and choose Copy, or press CTRL+C on your keyboard).
- Return to the Placeholders sheet, right-click in column B, beside the associated placeholder and choose Paste-Link. This associates your placeholder with the intended Origin object.
- If you intend to include your HTML report in an Analysis Template, you can right-click on a workbook tab in your Analysis Template and choose Add Notes as Sheet. This inserts your Notes window into workbook and you can now choose File: Save Workbook as Analysis Template.
| When a Notes window is active, you can click the Notes menu and load a sample HTML file into the Notes window.
|
Using Your HTML Report
As you fill in your Placeholders sheet, you should see your HTML report take shape in the Notes window. Once completed, you can do various things with your HTML report, including:
- Print to hard-copy or to PDF (File: Print).
- Export the window as a webpage (Notes: Export to Webpage).
- Click the embed button in the upper-right corner of the Notes window to embed the content into your workbook, then save the workbook as an Analysis Template (File: Save Workbook As Analysis Template).
Topics for Further Reading
|