9 Matrix Book Matrix Sheet Matrix ObjectsMatrix-Book-Matrix-Sheet-Matrix-Objects 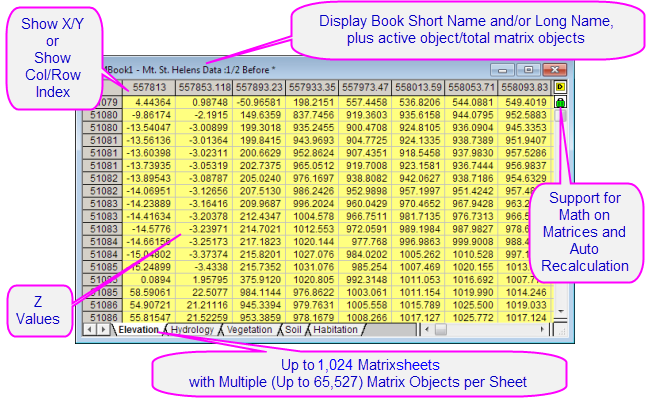
Matrixbooks, Matrixsheets and Matrix Objects
A matrix is a dataset of Z values arranged as an array of columns and rows which are linearly mapped to X and Y values.
Limitations, Matrix
The following table summarizes some important matrixbook limits:
| Maximum Number of...
|
32Bit OS
|
64Bit OS
|
|
Matrixsheets in a matrixbook
Matrix objects in a matrixsheet
Cells in a matrix (Note)
|
1024†
65,527
90,000,000
|
1024†
65,527
90,000,000
|
† > 255 sheets requires saving file to Unicode (e.g. *.opju) file format. Unicode formats not compatible with Origin versions prior to Origin 2018 SR0.
| Note: The product of any combination of rows and columns must not be greater than 90,000,000.
|
Naming Matrixbooks, Matrixsheets and Matrix Objects
Naming Matrixbooks
Matrixbooks, Naming
Matrixsheets, Naming
Naming Matrixsheets
Matrix Objects, Naming
Naming Matrix Objects
| Matrixbook
|
- The matrixbook has a Short Name whether you display it or not. Origin uses the Short Name for internal operations.
- Short Names must be unique within the project file, cannot contain spaces, must begin with a letter, consist only of alphanumeric characters (A to Z and 0 to 9), and limited to 13 characters. You can use lowercase characters and the text will appear as such, but upper and lower case are not unique characters. (You cannot name one matrix MBOOK1 and another mbook1.)
- Long Names are optional, need not be unique within the project file, can contain spaces, can begin with a letter, a number or a special character, and the length cannot exceed 520 characters, including spaces.
|
| Matrixsheets
|
- The sheet Name must be unique within the matrixbook and is limited to 32 characters.
- Can contain spaces and numbers.
- Can contain special characters except `!%"|()[]{}<>.
- Can begin with a letter, number or allowed special character.
- Optionally, sheet can have Label and Comments.
|
| Matrix Objects
|
- By default, Origin assigns a matrix object index number to each object, as it is created. This index number cannot be changed.
- You can add a name to the object by clicking on the yellow object icon -
 for a data matrix or for a data matrix or  for an image matrix - in the upper right corner of the matrixsheet and choosing Rename from the menu. Alternately, you can double-click on the matrix object number/name below the thumbnail and enter a name. for an image matrix - in the upper right corner of the matrixsheet and choosing Rename from the menu. Alternately, you can double-click on the matrix object number/name below the thumbnail and enter a name.
|
Different Views of the Matrix
Matrix, Data Mode vs. Image Mode
Region of Interest
Images, Matrix
In the worksheet, a dataset is contained in a single column and the dataset may consist of X,Y,Z, Error, or Label data. In the Origin matrix, a dataset is arranged in a specified dimension of rows and columns. The matrix contains a single dataset of Z values.
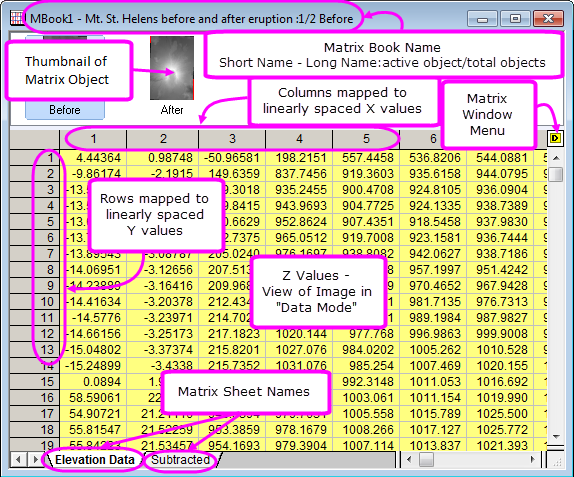
- Matrix columns are mapped to linearly-spaced X values.
- Matrix rows are mapped to linearly-spaced Y values.
Note that the matrix window has two column and row heading view modes:
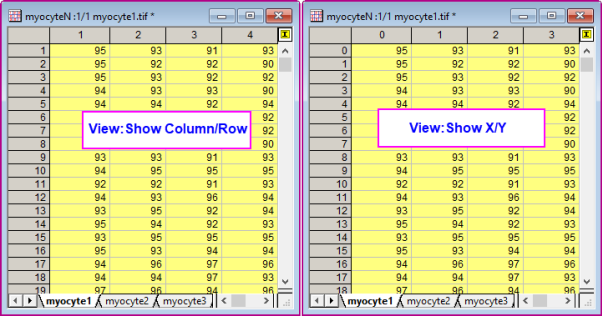
- By default, matrix row and column headings display as row and column index numbers (View: Show Column/Row from the menu or press Ctrl+Shift+C).
- You can opt to view matrix row and column as X and Y values by choosing View: Show X/Y from the Origin menu (or press Ctrl+Shift+X). The displayed X and Y values are the X and Y coordinate values, calculated by linear interpolation of the axes From and To values by the number of columns and rows.
In addition to the two row and column heading view modes, there are two matrix display modes:
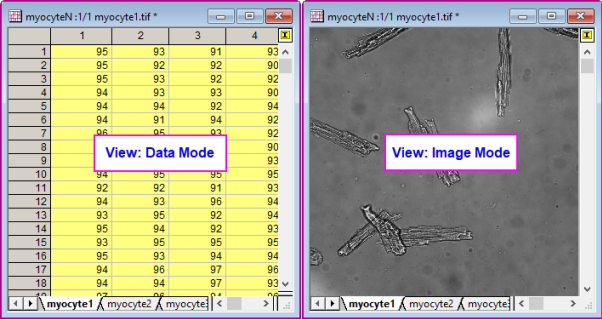
- In Data Mode (View: Data Mode from the menu or press Ctrl+Shift+D), the matrix object displays as raw numbers.
- In Image Mode (View: Image Mode from the menu or press Ctrl+Shift+I), the matrix object displays as either a gray scale image or a color image, depending upon the type of data in the matrix. A matrix of real numbers or complex numbers displays as a gray-scale image while RGB values will display as a color image.
| Note: If the matrix object is an image, the object icon will display as whether you are viewing the matrix object in Image Mode (View: Image Mode) or Data Mode (View: Data Mode). Similarly, when you import numeric data into the matrix, the object icon will display as regardless of View mode.
|
Matrixbooks
Matrix Objects
Like the workbook window, the matrixbook window is created from a customizable template (.otmu file). The matrix template stores such things as number of sheets in the book, the names of the matrixsheets, matrix dimensions, data type, math functions, data import handling instructions as well as various style and format options.
To add a empty new Matrix
- Click the New Matrix button
 on the Standard toolbar. on the Standard toolbar.
or
- Select File: New: Matrix: Black Matrixbook menu.
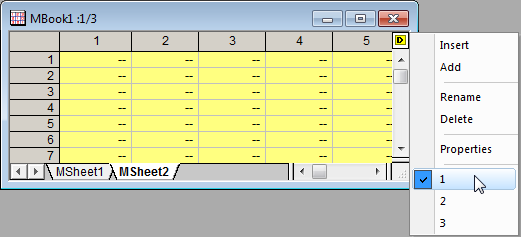
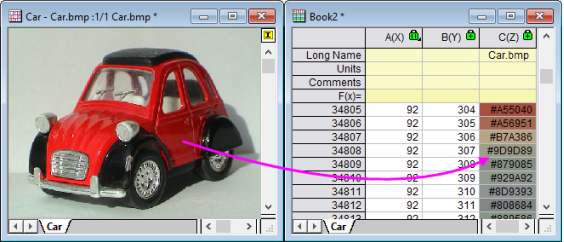
When you create a new matrixbook, the book is named MBookN, with N reflecting the order of window creation. Appended to the book name, you will see something like ":1/3" where the first integer denotes the active matrix object and the second denotes the number of matrix objects in the active matrixsheet. Following the above example, if you click the yellow object icon to the right side of the matrix, the menu shows three matrix objects with the first being the active one - the one with a check mark placed beside it (note that in our illustration, the objects are empty).
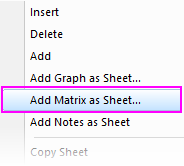
 | You can right-click on a worksheet tab and Add Matrix as Sheet and insert a matrixbook into a workbook. This is useful when building Analysis Templates that involve matrix-based operations such as 3D surface fitting or 3D plotting operations.
|
Matrixsheets
| Prior to Origin 2018, an Origin matrixbook could have a maximum of 255 sheets. That number is now increased to 1024. When you have more than 255 sheets in a book, you will need to save the file using one of the new Unicode-compliant formats (opju, ogmu, etc).
|
A matrixbook can have up to 1024 matrixsheets. The default matrixbook template - ORIGIN.otmu - has a single matrixsheet containing 32 rows and 32 columns. Each matrixsheet can differ in dimensions(number of rows and columns and X & Y range).
To specify the dimensions of the matrixsheet:
- Click on a tab to activate the sheet and choose Matrix:Set Dimensions/Labels. This opens the Matrix Dimensions and Labels dialog box.
- Specify a number of columns (X dimension) and rows (Y dimension).
- Specify a From and To value for X (columns) and Y (rows).
| Note: The X and Y coordinates of the matrix are evenly spaced. The first X is mapped to the first matrix column and the last X is mapped to the last matrix column. The X coordinates of other columns are interpolated. Matrix rows are similarly mapped using the From Y and To Y values. When plotting or analyzing matrix data, the position of a point in 3D space is determined by the column X and row Y coordinate values (not column or row index) and the Z value contained in the cell intersected by the row and column.
|
Matrix Objects
A matrixsheet can contain up to 65,504 matrix objects, though the actual limit is likely to be far less (determined by system resources). Objects in a sheet share the same X/Y dimensions and column (X) and row (Y) headers, but every object can have its own Z header. Other matrix object properties include internal data type and numeric display options.
Matrix object properties are set in the user interface via the Matrix Properties dialog box. To open the dialog box:
- Make sure that the matrix object is active (check mark shows beside it in the object menu).
- Choose Matrix:Set Properties... from the main menu.
| You can set properties for multiple matrix objects without closing the Matrix Properties dialog box by clicking the << Previous or Next >> buttons at the top of the dialog box.

|
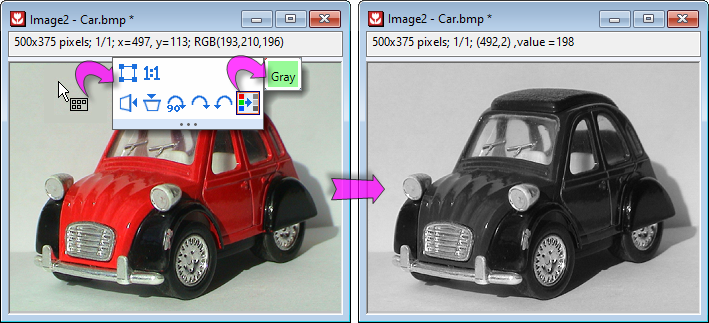
Import Image to Matrix
Origin has two structures for importing multi-frame images -- the matrix window and the Image window. The matrix window is better-suited to performing data analysis tasks (e.g. surface fitting, statistics, mathematic transformations of data, etc.) and some graphing operations, but take note of the following:
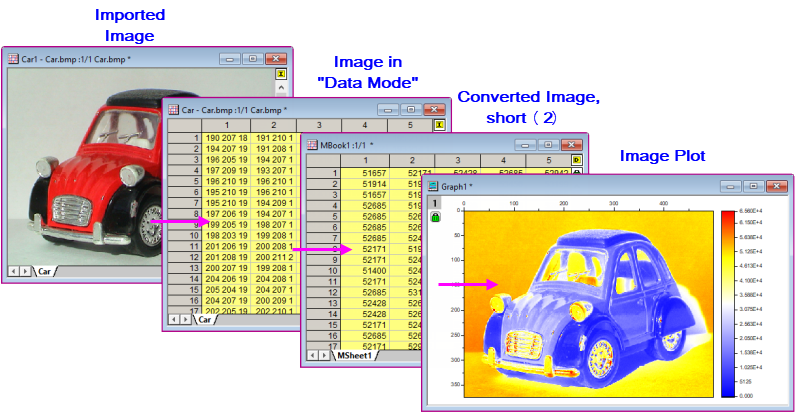
- When you import an image to the matrix, you can -- as with other matrix data -- switch between "Data Mode" (View Data Mode) and "Image Mode" (View: Image Mode).
- However, until converted to data, matrices contain RGB values (regardless of View mode), as seen in the second window in the sequence below.
- Performing certain analysis or graphing tasks (e.g. Nonlinear Matrix Fit or creating an Image Plot) requires that the matrix first be converted to Z values by choosing Image: Conversion: Convert to Data.
For more information, see Image Conversion in the Origin Help File.
To import an image or image stack to the matrix window:
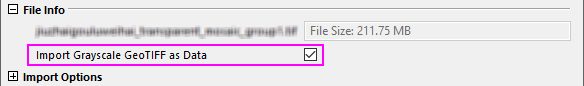
- With the matrix active, choose Data: Import From File: Image to Matrix.
- This opens the Image to Matrix (impImage) dialog. Note that there are are controls for Import Grayscale GeoTIFF as Data, Show Image Thumbnails and multi-file import-handling.
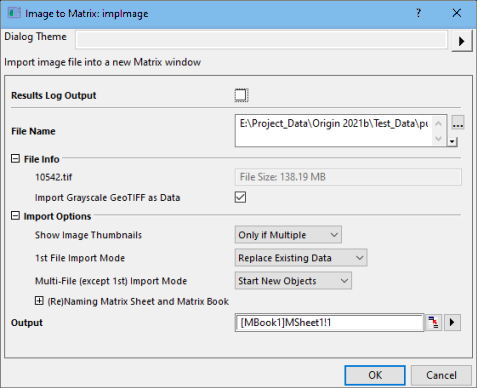
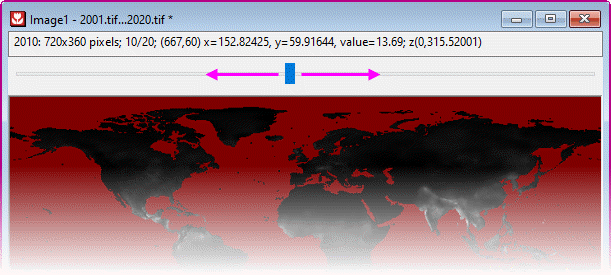
Image Thumbnails and Image Slider
| When importing multi-frame TIF files, thumbnail/slider display is controlled by system variable @MSS (default value =10):
- If the sheet contains a single frame, don't show thumbnail/slider.
- For 1 < frames < 10, show thumbnail
- For frames > 10, show slider
|
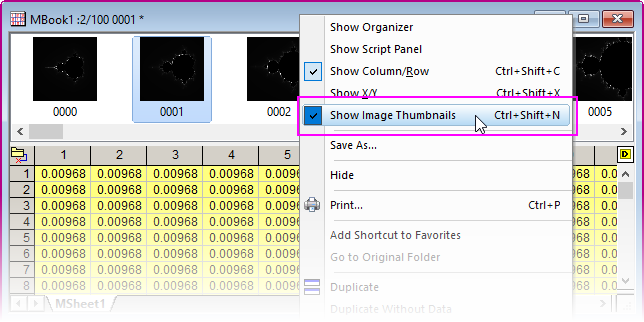
When the sheet contains multiple objects, you can display those objects as a series of thumbnails in a spacer at the top of the matrix window.
- Right-click on the matrix window title bar and place a check mark beside Show Image Thumbnails.
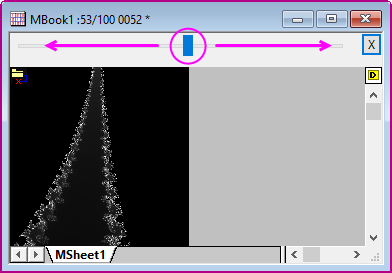
Alternately, you can use a slider control to view these objects in the active matrixsheet.
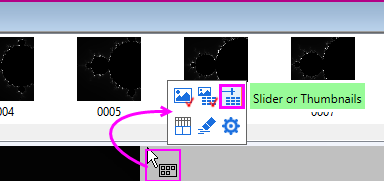
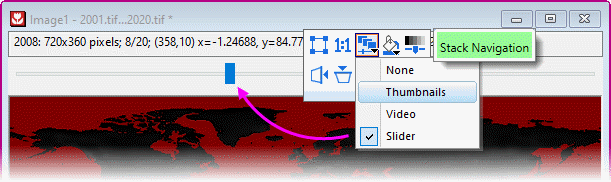
If you are seeing thumbnail images in the spacer at the top of the window, you can switch to the slider by doing the following:
- Hover in the space between the thumbnails and when the cursor changes to a grid icon
 , click to show the page Mini Toolbar (you can also click in the gray area to the right of your matrix image). , click to show the page Mini Toolbar (you can also click in the gray area to the right of your matrix image).
- Toggle the Slider or Thumbnails button to show slider or thumbnails.
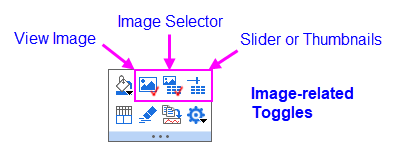
- Likewise, you can turn off both thumbnails and slider by clicking the Image Selector button. Click the View Image button to toggle between Data Mode and Image Mode.
Naming Matrix Objects
You can assign a name to a matrix object:
- With the matrix object active, choose Data: Define Name.
- Give the matrix a Name, set Scope and, optionally, add a Comment.
Named ranges can be used in Matrix: Set Values (e.g. to perform math operations on other matrix objects of the same dimensions).
Import GeoTIFF to Matrix
GeoTIFF is a public-domain image format that stores spatial information in a TIFF file and which has applications in mapping. Origin supports import of GeoTIFF files to both matrices and Image windows.
To import a GeoTIFF file to the active matrix:
- Click Data: Import From File: Image to Matrix.
- In the Image to Matrix dialog (impImage), check the Import Grayscale GeoTIFF as Data box and click OK.
For more information, see the Origin Help file page for GeoTIFF Importing and Processing.
Extracting Information from the Matrixsheet or Object
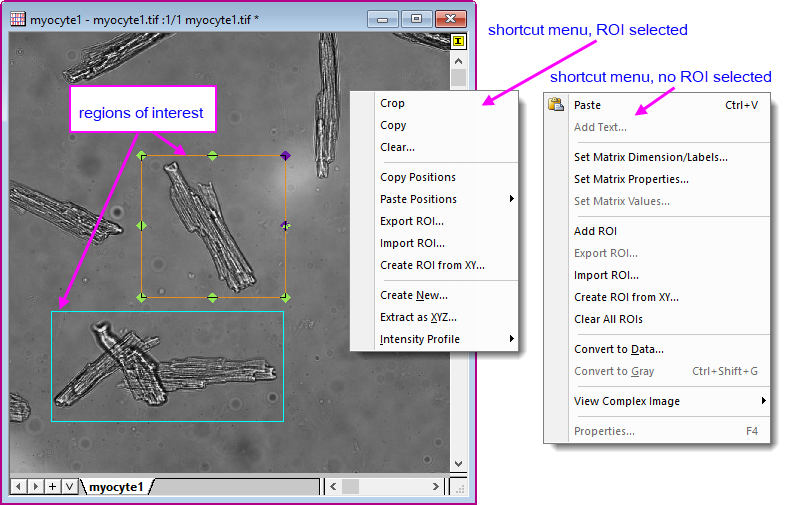
When viewing matrixsheets or matrix objects in Image Mode (View: Image Mode), you can extract information from the matrix using the Region-of-Interest (ROI) tools:
- Go to Tools: Region of Interest Tools and verify that there is a check mark beside the menu item. If not, click on this item or press CTRL + SHIFT + T to enable the ROI tools.
- To add an ROI, click on the displayed ROI tool (e.g. Rectangle Tool
 ) on the Tools toolbar and choose an ROI shape from the flyout menu (rectangle, circle, polygon, region). Alternately, you can right-click on the image (make sure no existing ROI is selected) and choose Add ROI from the shortcut menu. ) on the Tools toolbar and choose an ROI shape from the flyout menu (rectangle, circle, polygon, region). Alternately, you can right-click on the image (make sure no existing ROI is selected) and choose Add ROI from the shortcut menu.
- Using your mouse, drag out an area on the image (not needed if adding from the shortcut menu) and double-click to set your selection. Once the selection is set, additional clicks allow rotating, stretching, or skewing the ROI.
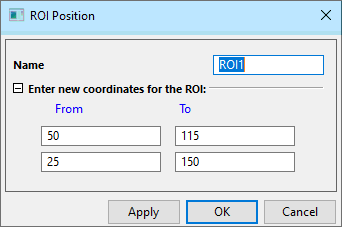
- You can add multiple ROIs using either the Add ROI shortcut menu (hint: right-click on the matrix image) or with the Tools toolbar buttons. Note that when adding multiple ROIs using the toolbar buttons, you'll need to rename each as it is created (otherwise, it will be destroyed when you create a new ROI). Double-click on the ROI to open a small dialog and change the Name of the object (hint: simply append a unique number to each Name).
- Right-click on your ROI and choose an option from the shortcut menu. To discard the selected ROI, press Delete:
- Crop: Crop the image to the minimum rectangular area that will contain the ROI. By default, values outside the ROI will show black (zero values in Data Mode).
- Copy: Rectangle only. Creates an image from the ROI.
- Clear: Clear data within the ROI(s). Available only for TIFF stacks, NetCDF data; otherwise unavailable (dimmed).
- Add ROI: Adds and enumerates name of each ROI (so that manual renaming is unnecessary when adding multiple ROIs).
- Copy Positions: Copy the position of the selected ROI.
- Paste Positions: Paste the position of the selected ROI to another ROI (width, height...all).
- Export ROI: Save the ROI object(s).
- Import ROI: Replace the object(s) with those in a saved *.ROI file (hint: create a "dummy" ROI to import).
- Create ROI from XY: Opens the Create ROI from XY (xy2roi) dialog where you designate XY coordinates for creating ROI.
- Clear All ROIs: Remove ROIs from matrixsheet.
- Create New: Use the mroi2mat tool to generate a new matrix from the ROI.
- Extract as XYZ: Use the mroi2xyz tool to generate a new worksheet of XYZ values.
- Intensity Profile: Use the mroiprofile tool to generate statistics for the ROI.
- Convert to Data: Convert RGB image to data.
- Convert to Gray: Convert RGB image to grayscale.
- View Complex Image: View components of the complex image.
| ROI stats are automatically reported to the Status Bar. Right-click on the Status Bar to hide or show statistics.
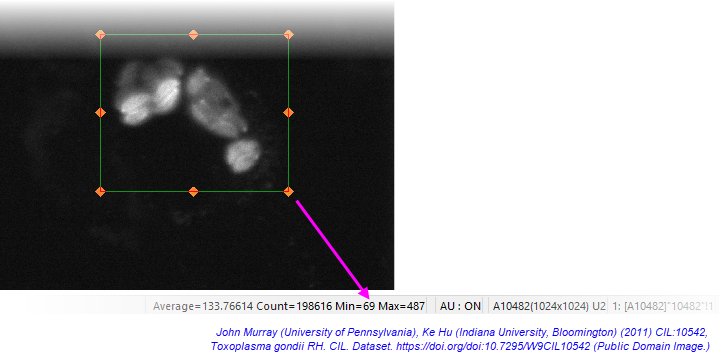
|
Image Plot
Data in a matrix can be plotted as an Image Plot. Axis scales are determined by the matrix XY coordinates (when the matrix is active, choose View: Show X/Y).
Note that if you import an image to the matrix (Data: Import From File: Image to Matrix) you must first convert the image to data (Image: Conversion: Convert to Data) before creating your Image Plot (Plot: Contour: Image Plot).
- Activate a matrix window and choose Plot: Contour: Image Plot.
By default, the image plot will use the same colormap, Z scale range and missing value color, as matrix image mode (View: Image Mode). See Matrix: Apply Palette to Color Map, below.
Image Window
The Image Plot described above is used to plot values in a single matrix object. The Image Window can be used to:
- Open an image file for basic manipulation (flip, rotate, convert to gray-scale) using the Image Window's Mini Toolbar.
- Edit an image inserted into a worksheet cell or graph window (double-click on the inserted image).
- Import an image set such as the common "TIFF stack".
- Import multiple discrete image files as an image stack.
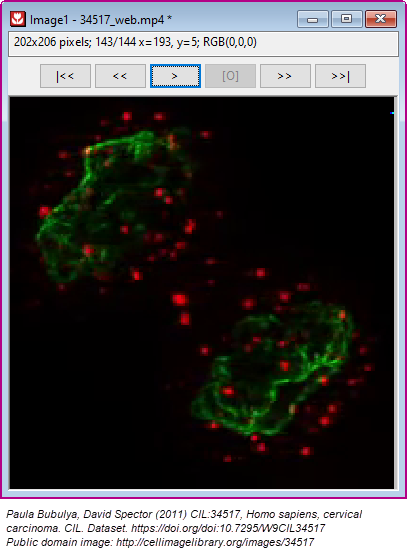
- Open and play a movie (.avi, .mov, .mp4) file.
- Define one or more regions-of-interest (ROI) for which you can Copy Positions, Paste Positions (from another ROI), and Export or Import position information saved to an Origin *.ROI file (a text file with position information on each ROI on the image).
- Open and operate on images inserted to worksheets or graphs: crop, copy, export ROI, etc.
Image and Video Import
- Choose File: New Image, then choose an option from the flyout menu.
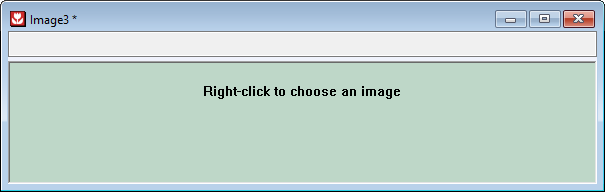
- Empty Window: You can later add a file by right-clicking and choosing Import or Import from Web. Alternately, click the New Image button
 on the Standard toolbar. on the Standard toolbar.
- Image/Video (CTRL + ALT + I): Use the file type drop-down to specify an image or video file format.
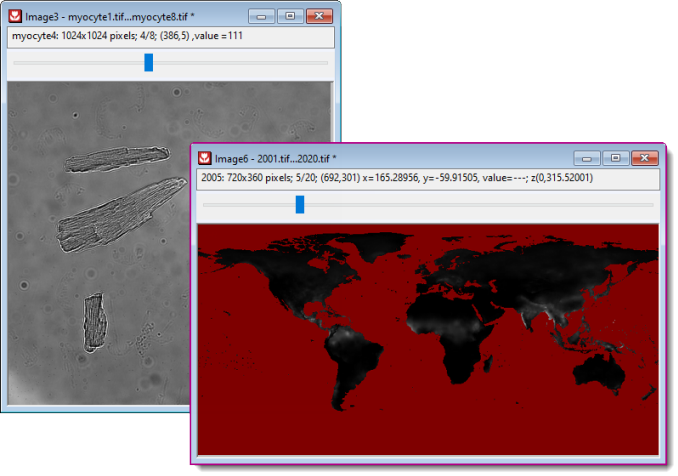
- Multiple Image Files (CTRL + ALT + T): Specify which files to import as a stack, including GeoTIFF. Note that the resulting stack will show an image slider, by default.
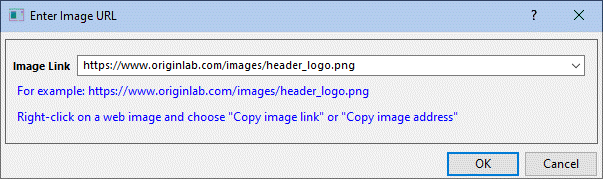
- Web Image (CTRL + ALT + L): Enter a URL in the dialog to link to a web-stored image. Hint: to grab an image URL, right-click on the web image and choose Copy image link or Copy image address.
Import GeoTIFF as Image
GeoTIFF is a public-domain image format that stores spatial information in a TIFF file and which has applications in mapping. Origin supports import of GeoTIFF files to both matrices and Image windows.
To import a GeoTIFF file as an image:
- Click File: New: Image: Image/Video and choose the GeoTIFF image.
To import multiple GeoTIFF files as image:
- Click File: New: Image: Multiple Image Files and choose your images. Images are imported to the active Image window and a slider is added to scroll images.
- All Images must be the same size.
- Negative numbers (e.g. -999) are treated as missing values.
- The Image window Mini Toolbar has a button for setting Missing Value Color
- Convert an Image window containing multiple GeoTIFF files to matrix using Image: Convert to Matrix. Each image in the stack becomes an object in the output matrix.
| Click inside the window, somewhere near the top, to show the Mini Toolbar.
|
For more information, see the Origin Help file page for GeoTIFF Importing and Processing.
Image Import Notes
- To help control Origin project file size, right-click on an Image Window image and enable Linked File. This saves a link to the image file into the window but excludes the image from the saved project. When you reopen the saved project, the window will appear empty; at this point, you can decide whether you need to re-import the image (CTRL + 4 or Import from the window shortcut menu).
- Actual Size Mode is turned on by default for images of max width or height of less than 800 pixels. The size threshold can be adjusted using system variable @IWP (see this FAQ for info on changing the value of a system variable).
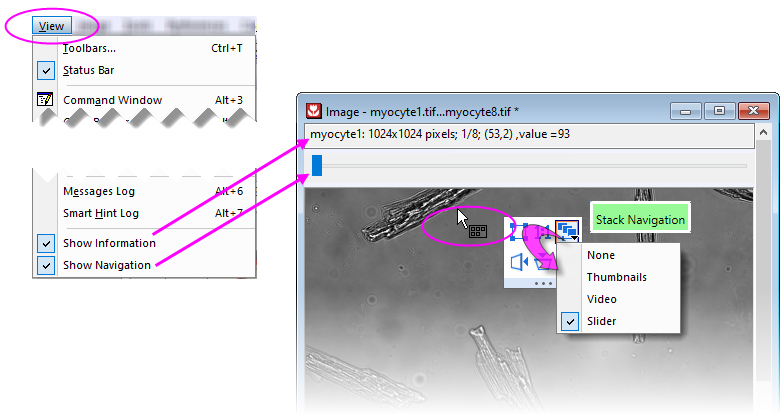
Image Window Navigation
Display of image information and navigation controls is enabled or disabled via the the View menu and/or the Image Window Mini Toolbar (None, Thumbnails, Video or Slider).
The same Mini Toolbar button is shown for GeoTIFF images:
Additional Keyboard control for Video navigation
- Pressing the left/right arrow keys will move the frame by 1.
- Shift + arrow key will move the frame by 5.
- Shift + Ctrl + arrow key will move the frame by 20.
Image Resize
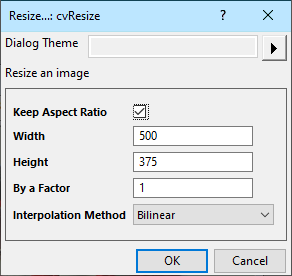
To resize the image by one of several interpolative methods:
- With the Image Window active, choose Image: Resize.
- Choose options including your Interpolation Method (Nearest Neighbor, Bilinear, Bicubic, Pixel Area Relation, Lanczos) and click OK.
Mini Toolbars for Image Window
Mini Toolbar buttons are available for performing simple image manipulation, including rotating, flipping or converting to grayscale.
| You can apply a color palette to a grayscale image using the Palette button  on the Style toolbar. Click More Palettes to open the Color Manager dialog box and add more palettes. on the Style toolbar. Click More Palettes to open the Color Manager dialog box and add more palettes.
|
ROIs in the Image Window
| If your ROI is hard to see against the background image, you can select the ROI and use the Style toolbar Line/Border Color button  to change outline color. to change outline color.
|
You can define one or more regions-of-interest in the Image window using the Rectangle Tool  ) on the Tools toolbar. ) on the Tools toolbar.
- Select the tool and drag out an ROI. Once added, adjustments to size and position can be made by selecting the object and dragging the blue selection handles.
- To add multiple ROIs to an image, click on the Rectangle Tool and drag out your ROI; right-click on the image and choose Add ROI (CTRL + Q); or use the Add ROI button on the Image window Mini Toolbar. In either case, you'll need to rename added ROIs as you go: double-click on the ROI and give it a unique name so that it is not replaced by the next added ROI.
Right-clicking on the ROI produces a context menu with the following options:
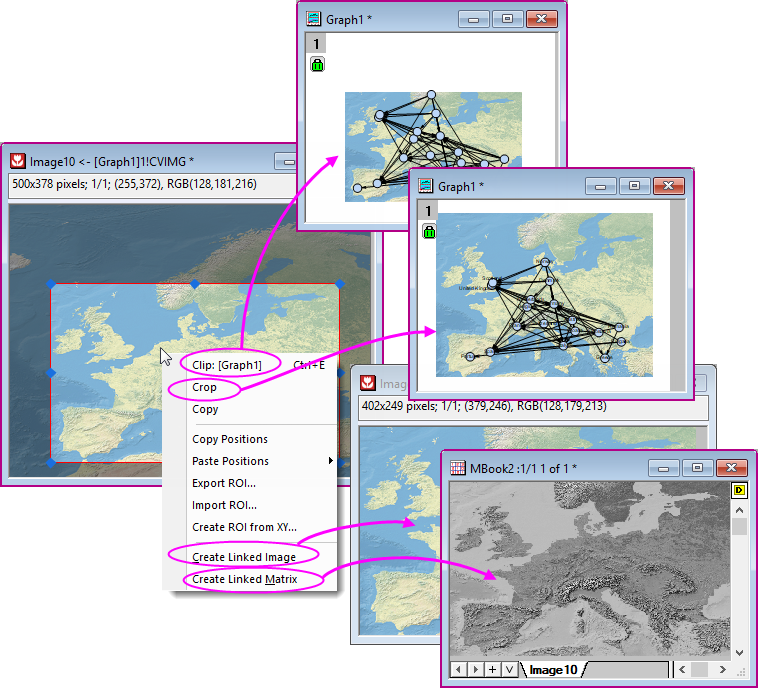
- Clip: Available when the image is opened from a graph (e.g. by double-clicking the graph image). This clips the graph image to the Image window ROI. The original graph image size is reduced to the size of the clipped region. To restore the full image in the graph window, right-click outside of the ROI and choose Remove Clipping.
- Crop: Crop Image window image and graph image (if exists) to the ROI. Graph image size and position are kept.
- Copy: Copy the ROI as an image. You can then paste it to other windows inside Origin, e.g. a graph or worksheet window, or to other applications. For multi-frame image, only the active frame is copied.
- Apply Scale to Graph: Available when the image is inserted into a graph by Image from Image Window. This updates the graph image to the Image window ROI.
- Copy Positions: Copy the ROI box coordinates of 4 vertices. You can choose to paste it as plain numbers, or, Paste Position to another ROI box. For the latter option, you can choose to paste only ROI Width/Height, or Horizontal/Vertical location.
- Export ROI: Saves details (e.g. ROI name, position of vertices, etc.) to a .ROI file.
- Import ROI: Applies details of a previously-saved ROI, to the selected ROI.
- Create New from XY: Create a new ROI box of arbitrary shape from a set of XY coordinates (boundary) and index data. Support for gray-scale image only. See also Create ROI from XY in NetCDF data.
- Create Linked Image: Outputs the ROI to a new Image window. Changes to the ROI will be passed to the new Image window.
- Create Linked Matrix: Outputs the ROI data to a new matrix window. Changes to the Image window ROI will be passed to the matrix.This makes it easier to carry out many analysis and statistics operations that cannot be done on an Image window (i.e. a matrix is required).
Profiling Matrix Data
Profiling Matrix Data
Matrix, Profiling
Profiling Images
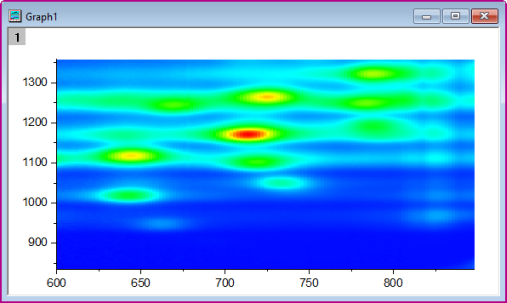
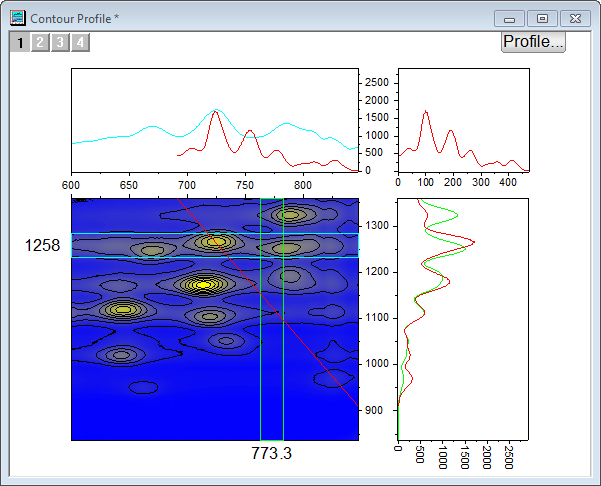
Data in a matrix can be viewed in profile -- either in the X, Y or arbitrary cross-section.
- Activate the matrix object and choose Plot > 2D: Profile: Image Profiles from the main menu.
This creates an image plot and opens the Image/Contour Profile dialog box. Use the dialog box to specify X and/or Y profile plots and the location and appearance of the cross-sectional lines. Note that this dialog box is interactive. You can make adjustments to your image profile -- move the cross-sectional lines or change the configuration or the appearance of the plots -- without closing the dialog box. After closed the dialog box, a button Profiles...will appear at the right-top corner of graph window, which can be used to reopen the Image/Contour Profiles dialog.
Setting Matrix Values
Matrix, Set Values
Set Matrix Values
The Set Values dialog box is used to generate or transform data in a matrix object.
| You can assign a name to a matrix object and use the name Set Values (e.g. to perform math operations on other matrix objects of the same dimensions).
|
To open the Set Values dialog box, make sure that the matrix object is active, then:
- From the menu, choose Matrix: Set Values.
or
- Select the matrix by clicking in the upper-left corner (in the empty header cell just below the matrix icon/name), then right-click on the matrix and choose Set Matrix Values from the shortcut menu.
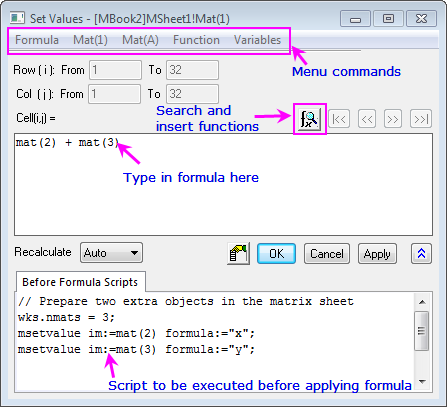
| Menu Commands
|
- Formula: Load a saved formula into the matrix formula box. Formula are saved using Formula: Save or Formula: Save As....
- Mat(1): Use the menu to include matrix objects in either your matrix formula or your Before Formula Scripts (matrix object reference is inserted at the cursor). A Matrix Browser is available to help in selecting the correct objects. Objects are listed by object index.
- Mat(A): Similar to Mat(1) menu functionality but matrix objects are listed by object Long Name, if one exists.
- Function: Add LabTalk functions to your expressions (function name is inserted at the cursor).
- Variables: Add a variable or a constant to Matrix Formula or Before Formula Scripts; Add range variables (including by selection) or file metadata, to Before Formula Scripts.
|
| Matrix Formula
|
- Add a single line expression for generating data. Functions, conditional operators and variables can be used.
|
| Before Formula Scripts
|
- Enter one or more lines of LabTalk script to be executed before the expression in the Matrix formula box is executed.
|
| Use the Before Formula Scripts panel at the bottom of the Set Values dialog box to define variables or LabTalk functions that you wish to use in your matrix formula.
Click the Search and Insert Functions button  to search for built-in LabTalk functions. to search for built-in LabTalk functions.
|
Manipulation of Matrix Data
Matrix, Manipulating Data
| Utility
|
Menu Access
|
- For an XY coordinate pair picked with the Screen Reader, output Z values for for the matrix stack (multiple matrix objects) to a worksheet.
|
Matrix: Pixel Extraction
|
|
|
Matrix: Rotate90
Matrix: Flip: Vertical
Matrix: Flip: Horizontal
|
- Resize a matrix using one of four methods (Expand, Shrink, Interpolate and Pad).
|
Matrix: Resize
|
|
|
Matrix: Transpose
|
- Generate a 3-dimensional dataset by transforming XYZ values by formula.
|
Matrix: Generate Grid
|
- Expand the matrix by scaling in the X and Y directions.
|
Matrix: Expand
|
- Shrink the matrix by some row/column factor, using one of several shrink methods.
|
Matrix: Shrink
|
- Use a palette file to transform a matrix in Image Mode. Set a system variable to apply a color palette (Style toolbar, Palettes button) to all matrix objects (@MAP=0, default) or only the active matrix object (@MAP=1).
|
Matrix: Apply Palette to Color Map
|
- Convert a matrix of values to worksheet columns (see next section).
|
Matrix: Convert to Worksheet
|
Changing the Color Scheme of a Matrix
You can use the Palette  button and the Missing Value Color button and the Missing Value Color  button in the Mini Toolbar to customize the color of the matrix window. button in the Mini Toolbar to customize the color of the matrix window.
| The selected palettes and missing value color will apply to all matrix objects in the active matrix sheet, but will not change the palettes and missing value colors of objects in other matrix sheets in the same matrix window.
|
Converting Matrixes to Worksheets
Worksheets, Converting from Matrix
Matrix, Converting to Worksheet
To convert a matrix to worksheet:
- With a matrix active, choose Matrix: Convert to Worksheet: Open Dialog.
There are two methods for converting matrix data to worksheet data -- Direct and XYZ Columns. Starting, for instance, with the following arrangement:
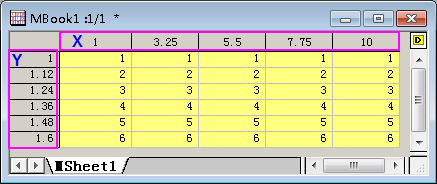
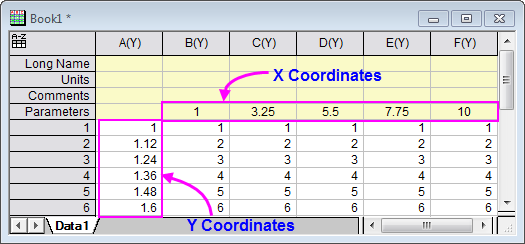
Direct
This copies the Z values in the matrix to a worksheet with no reordering. If the matrix consists of M rows by N columns of Z values, this method produces a worksheet which has M rows and N columns. By default, the X and Y coordinates of the matrix Z values are not copied to the worksheet. You can opt to copy X coordinates to the 1st worksheet row or a parameter row and the Y coordinates to the 1st worksheet column.
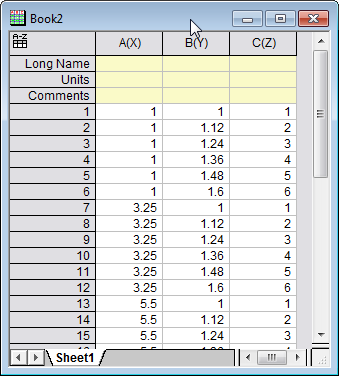
XYZ Columns
When there is a single matrix object, this method produces a worksheet with three columns: X,Y, and Z, with X and Y columns containing the X and Y coordinate values and the Z column containing the matrix Z value at each XY coordinate.
In addition, this method:
- Saves matrix object Long Name, Units and Comments to the Z column label rows.
- If the converted matrix contains a color image, the resulting Z column will display a Color column of HTML colors for each matrix cell.
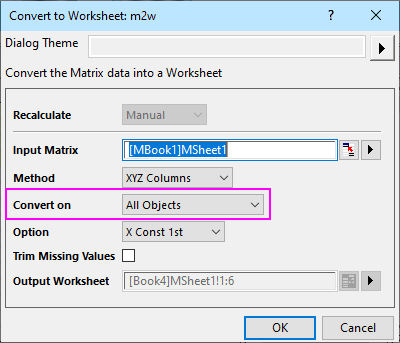
When converting multiple matrix objects:
When there are N matrix objects, you can set Convert On = All Objects and output columns as X, Y and Z x N (i.e. XYZZZ...).
Converting Worksheets to Matrixes
- With the worksheet active, choose Worksheet: Convert to Matrix and choose one of the following methods:
Worksheets, Converting to Matrix
Matrix, Converting Worksheet Data
| Method
|
Conversion Type
|
Notes
|
| Direct
|
- X across columns
- Y across columns
- No X and Y
|
Ideal for spreadsheet data that conforms to the following:
- X data values in the 1st column, Y data values in the 1st row and Z values in columns 2 to N and rows 2 to M.
- Y data values in the 1st column, X data values in the 1st row and Z values in columns 2 to N and rows 2 to M.
Note: See Virtual Matrix, below.
|
| Expand
|
|
Some ASCII files have an upper limit for characters allowed on a single line. Use this method when your file breaks a single line of data across multiple lines.
- Expand by Row: specifies the number of ASCII file rows comprising one matrix row.
- Expand by Column: specifies the number of ASCII file columns comprising one matrix column.
|
| XYZ Gridding
|
- Regular
- Sparse
- Random (Renka Cline)
- Random (Shepard)
- Random (Thin Plate Spline)
- Random (Kriging Correlation)
- Random (Weighted Average)
|
Conversion Type depends upon XY spacing:
- Choose Regular applied for data that are regularly spaced in XY.
- Choose Sparse when you have missing values.
- Choose Renka-Cline, Shepard, TPS, Kriging or Weighted Average methods for data that are irregularly spaced in XY. Option for No Extrapolation outside Boundary.
Note: a worksheet of XYZZZ... columns will be converted to a matrixsheet with each Z column as a separate object.
|
| XYZ Log Gridding
|
methods same as XYZ Gridding
|
Calculates logarithmic values for X and Y, then performs XYZ Gridding. A worksheet of XYZZZ... columns will be converted to a matrixsheet with each Z column as a separate object.
|
Virtual Matrix
Matrix, Virtual
Virtual Matrix
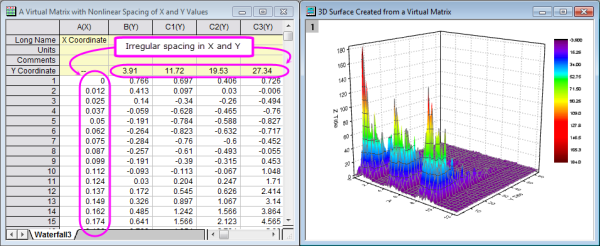
Data arranged in a block of worksheet cells can be treated as a "virtual matrix". As is the case with regular matrix data, virtual matrix data can be used to create 3D plots, such as color mapped surfaces or contour plots. The data can include a column or label row with the X or Y values. Unlike a regular matrix which only supports a linear spacing in the X and Y dimensions, a virtual matrix supports irregular spacing of X and Y coordinate values (provided those values are in ascending or descending order).
Topics for Further Reading
|