13 GadgetsGadgets
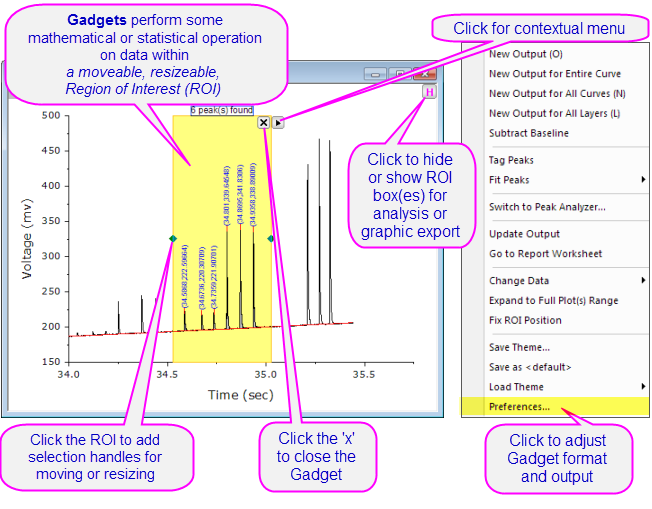
Gadgets provide a quick and easy way to perform exploratory analysis on plotted data. The concept is simple: While each Gadget has a specific purpose, each is built around applying a set of customizable analysis operations to a range of plotted data defined by a movable, resizable, region-of-interest (ROI) object.
You can drag to modify the ROI at any time, then change your analysis options and recalculate results by clicking the arrow button in the upper-right corner of the ROI and choosing one of the menu options. For general access to Gadget formatting and analysis options, choose Preferences at the bottom of the context menu. Use the Preferences Dialog Theme box to save a group of Gadget settings to a Theme file.
Multiple Gadgets are supported on a graph. You can distinguish ROIs by giving each a different color. Click on an ROI object to bring it forward. When an ROI is selected, you can use the TAB key to switch the ROI.
Gadgets
Differentiation
Integration
Interpolation
Peak Analysis
Rise Time
Statistics
2D Integration
Contour ProfileImage Profile
Region of Interest (ROI)
Derivatives, Plot
FFT
Curve Fitting
Sigmoidal Fit
Descriptive Statistics
Coordinate Values, Reading/Annotating
 | Origin 2016 introduced add-on tools called Apps. Since being introduced, many new exploratory and analysis-related tools have been added to OriginLab's File Exchange and more tools are being released all the time. Please visit the File Exchange to review available tools.
|
Origin Gadgets
The Gadgets main menu is available when a graph window is active. There are 14 gadgets available in Origin.
| Cluster Gadget
|
View statistics on points inside or outside of a graphically-defined region-of-interest (rectangular, circular/elliptical or arbitrarily-shaped). 
|
| Differentiate Gadget
|
Calculate and plot the nth-order derivative of selected data.
|
| FFT Gadget
|
View FFT spectrum of selected data.
|
| Integration Gadget
|
Calculate the area under a curve, or between two curves.
|
| 2D Integration Gadget
|
Calculate the 2D integration for a contour or image graph created from matrix or XYZ worksheet data.
|
| Interpolate Gadget
|
Perform linear, spline, b-spline or Akima spline interpolation of selected data.
|
| Intersect Gadget
|
Calculate the intersection points of two or more data plots.
|
| Quick Fit Gadget
|
Perform linear, polynomial, or nonlinear fitting of selected data.
|
| Quick Peaks Gadget
|
Locate peaks, and compute area and other peak properties.
|
| Quick Sigmoidal Fit Gadget
|
Perform Sigmoidal fit of selected data.
|
| Rise Time Gadget
|
Analyzes rise/fall time for the step-like signal.
|
| Statistics Gadget
|
Compute and display simple descriptive statistics of selected data on the graph.
|
| Vertical Cursor Gadget
|
Read coordinate values and label data plots across multiple graph layers that share the same X axis.
|
| Image/Contour Profile
|
Analyze the image or contour from matrix data and generate profiles.
|
| Curve Translate Gadget
|
Drag a curve in the vertical or horizontal direction, adjusting source data in the process.
|
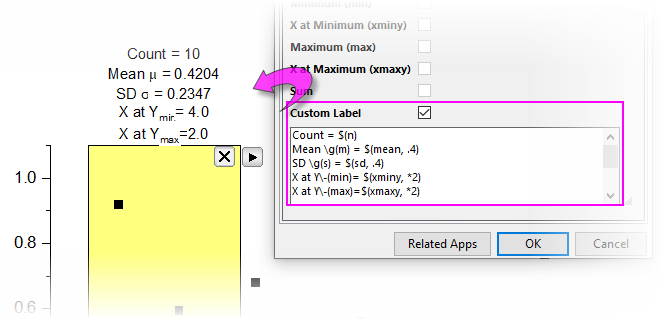
Custom Label for ROI Box
Origin supports custom labeling of the ROI Box for the Quick Fit and Statistics gadgets. Custom labels are preserved and updated when you select new output. Further, they can be saved as part of a Dialog Theme.
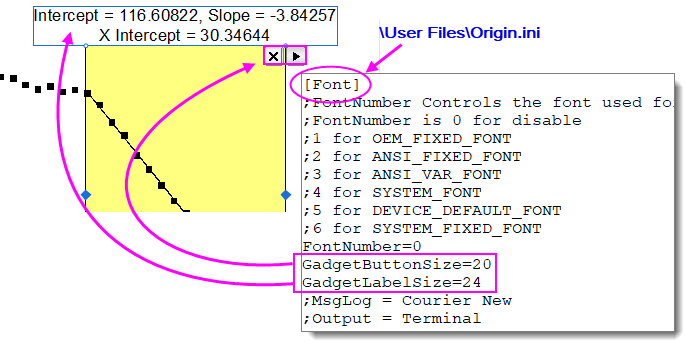
Custom Label and Button Size
General Change Label Font Size and Button Size of Any Gadget
To customize the label font size and button size (both the close button and the menu flyout button):
- Open \User Files\Origin.ini and search for the [Font] section.
- Add two lines to this section as shown in the image below, then save the file with your additions.
- Any new Gadgets added to the window should use the new font and button size. Adjust as needed.
Quick Fit Gadget
- Choose a gadget from the Gadgets: Quick Fit menu.
- Open the gadget dialog (hint: if the ROI is already added, click the menu button
 and choose Preferences). and choose Preferences).
- Click the ROI Box tab and enable Custom Label.
- Build your custom label using a mix of (a) literal text (b) escape sequences (e.g. Greek symbols or superscripts) and (c) custom variables. Specify decimal places, etc. using Origin custom formats.
| Dialog Label
|
Custom Variable
|
Example
|
| Reduced Chi-Sqr
|
chisqr
|
Chi-Square \g(c)\+(2) = $(chisqr, .2)
|
| R-Square
|
cod
|
R-Squared r\+(2) = $(cod, .2)
|
| Pearson's r
|
r
|
r = $(r, .2)
|
| Y Intercept
|
intercept
|
Y Intercept = $(intercept, .2)
|
| Slope
|
slope
|
Slope = $(slope, .2)
|
| X Intercept
|
xintercept
|
X Intercept = $(xintercept, .2)
|
Statistics Gadget
- Choose Gadgets: Statistics: Open Dialog (hint: if the ROI is already added, click the menu button and choose Preferences).
- Click the Show on Center-Top of ROI Box tab and enable Custom Label.
- Build your custom label using a mix of (a) literal text (b) escape sequences (e.g. Greek symbols or superscripts) and (c) custom variables. Specify decimal places, etc. using Origin custom formats.
| Dialog Label
|
Custom Variable
|
Example
|
| N
|
n
|
Count = $(n)
|
| Mean
|
mean
|
\g(m) = $(mean, *4)
|
| SD
|
sd
|
\g(s) = $(sd, .2)
|
| Minimum
|
min
|
Min = $(min, .2)
|
| X at Minimum
|
xminy
|
X Min = $(xminy, .2)
|
| Maximum
|
max
|
Max = $(max, .2)
|
| X at Maximum
|
xmaxy
|
X max = $(xmaxy), .2)
|
| Sum
|
sum
|
Sum = $(sum, .2)
|
Topics for Further Reading
|