15 StatisticsStatistics
Apps for Statistics
Origin 2016 introduced add-on tools called Apps. Since being introduced, a number of statistics-related graphing and analysis Apps have been added to OriginLab's File Exchange and more tools are being released all the time.
A few Apps are installed with your Origin software. Note that as of the fall of 2019, all Apps are available at no extra cost and they are easily added to Origin. Click Statistics: Find Apps. This opens the App Center to show only statistics-related Apps. Browse available Apps and click the Download and Install button  to install an App. to install an App.
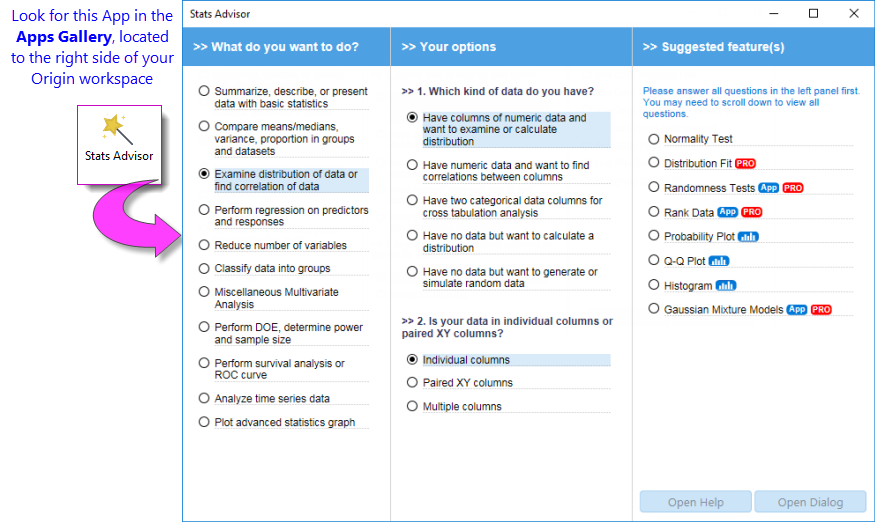
Origin includes a pre-installed App called Stats Advisor. This App uses an interactive "wizard" interface to help you choose appropriate statistical tests and to tell you where to find them in your Origin software, or -- if the test is available from another add-on App -- where to find it on the OriginLab File Exchange.
Basic Statistics
Descriptive StatisticsStatistics, Descriptive
Statistics, Basic
 | Many of Origin's advanced statistical tests are available only in OriginPro. Users of standard Origin will see these Pro-only tests marked as (Pro) in the main menu. If you own the standard version of Origin but find that you need features of OriginPro, you can upgrade by contacting your Origin representative.
If you wish to continue using standard Origin without seeing (Pro) menu commands, click Preferences: System Variables and enter the following in the Set System Variables dialog box and click OK (Comment is optional):
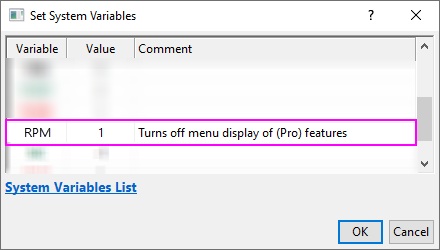
|
Basic Statistics on Worksheet
| Descriptive Statistics
|
Menu entry with worksheet active
|
- Statistics on Columns
- Statistics on Rows
|
Statistics:Descriptive Statistics
|
|
|
No menu access. To open the dialog box:
- Click Window: Script Window.
- At the cursor, type
statsxy -d and press Enter.
|
- Cross Tabulation and Chi-Square

|
Statistics:Descriptive Statistics
|
| Frequencies/Counts
|
|
- Discrete Frequency
- Frequency Counts
- 2D Frequency Counts/Binning
|
Statistics:Descriptive Statistics
|
| Distribution
|
|
- Distribution Fit
- Normality Test
|
Statistics:Descriptive Statistics
|
| Relationship
|
|
- Correlation Coefficient
- Partial Correlation Coefficient
|
Statistics:Descriptive Statistics
|
| Detecting Outliers
|
|
- Grubbs Test
- Dixon's Q-test
|
Statistics:Descriptive Statistics
|
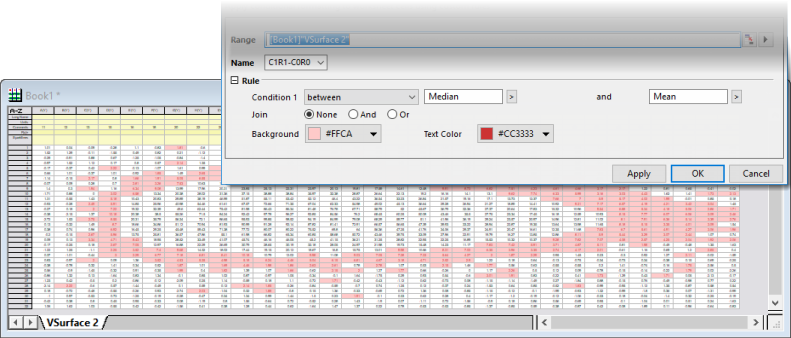
| You can apply Conditional Formatting to a worksheet by applying mathematical expressions or statistics to cell values. For more information, see Conditional Formatting.
|
Descriptive Statistics on Graph
Origin provides a couple of gadgets to explore and summarize data plotted in graphs.
| Descriptive Statistics
|
Menu entry with graph active
|
- Cluster Gadget
|
Gadgets:Cluster...
|
|
|
Gadgets:Statistics...
|
Descriptive Statistics on Matrix
| Descriptive Statistics
|
Menu entry with matrix active
|
- Output descriptive statistics (mean, sd, min, max, etc.) on the matrix stack (series of matrix objects), for each pair of XY coordinates.
|
Analysis: Descriptive Statistics
|
Statistics on Selected Range
Origin provides some quick ways to obtain basic statistics on a selected range of worksheet cells, or data plot(s) in a graph.
Status Bar
Statistics, Data Selection
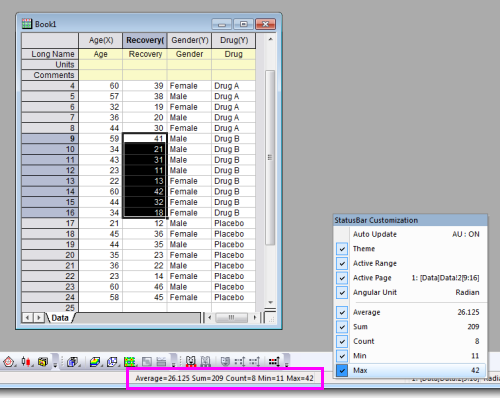
Select a range of cells in a worksheet. Note that the selection can include cells from one or more columns, and you can use the CTRL key to select non-contiguous groups of cells. Statistics, Report to Status Bar
Basic statistics (average, sum, count, min, max) for your selected data will be displayed in the status bar. Right click on the status bar to customize what quantities to display.
Command or Script Window
Statistics, Report to Script/Command Window
- Select a range of cells in a worksheet, or click and select a group of data plots or an individual data plot in a graph.
- Open the Command Window or the Script Window from the Windows menu, and type one of these commands, then press ENTER:
stats
moments
quantiles
With the Command Window, the results are typed out below the command line. With the Script Window, you will need to issue an additional command to return your results:
stats;
stats.=;
| Note: For more information, please refer to the:
Help: X-Function > X-Function Reference > Statistics
|
Statistical Graphs
Statistics, Charts
Origin provides numerous statistical graph types. All graphs can be easily customized and saved as a template for repeat use. View the Graphing and Customizing Graphs chapters of this guide for more information.
| Graph Type
|
Plot Menu Category
|
|
Box Charts: Box, Interval Plot, Bar Charts, Box Overlap, Box Normal, Half Box, Bar Overlap, Bar Normal, Scatter Interval, Double-Y Box, Marginal Box Charts.
| Box Scale is available for box charts, diagramming key user-selected box statistics.
|
|
Statistical
|
|
Box Charts, Violin Plots, etc., Grouped: Grouped Scatter - Indexed Data, Grouped Box Charts - Indexed Data, Grouped Box Charts - Raw Data, Grouped Column Scatter - Indexed Data, Grouped Interval Plot - Indexed Data, Grouped Mean Bar - Indexed Data, Grouped Violin - Indexed Data, Grouped Half Violin - Indexed Data, Grouped Half Box - Indexed Data.
|
Categorical
|
|
Violin Plots: Violin Plot, Violin with Box, Violin with Point, Violin with Quartile, Violin with Stick, Split Violin, Half Violin.
|
Statistical
|
|
Histograms: Histogram, Histogram + Rug, Histogram + Probabilities, Multi-Panel Histogram, Distribution, Distribution + Rug, Histogram with Labels, Stacked Histograms, Marginal Histograms.
|
Statistical
|
|
Population Pyramid
|
Statistical
|
|
2D Kernel Density
|
Contour
|
|
Heatmap: Heatmap, Heatmap with Labels, Split Heatmap
|
Contour
|
|
Contour - Categorical Z
|
Contour
|
|
Cluster Plots
|
Categorical
|
|
Probability: Probability Plot, Q-Q Plot.
|
Statistical
|
|
Pareto and QC Chart: Pareto Chart - Binned Data, Pareto Chart - Raw Data, QC (X-bar R) Chart.
|
Statistical
|
|
Bland-Altman Plot (Tukey mean-difference)
|
Statistical
|
|
Scatter Matrix
|
Statistical
|
|
Trellis Plot: Trellis Plot, Double-Y Trellis Plot, Double-Y Trellis Plot
|
Categorical
|
|
Parallel Plot: Parallel Plot, Parallel Sets, Parallel Index.
|
Categorical
|
The following statistical graphs are only available within the Plots branch of the statistical analysis dialogs.
| Graph Type
|
Menu Entry
|
- Means Plot
- Means Comparison Plot
|
Statistics: ANOVA: One-Way ANOVA, Two-Way ANOVA
Statistics: ANOVA: One-Way Repeated Measure ANOVA
|
- Survival Curve
- One Minus Survival Curve
- Hazard Curve
- Log Survival Curve
|
Statistics: Survival Analysis: Kaplan-Meier Estimator
|
- Scree Plot
- Component Plot
|
Statistics: Multivariate Analysis: Principal Component Analysis
|
|
|
Statistics: Multivariate Analysis: Hierarchical Cluster Analysis
|
- Classification Summary Plot
- Classification Fit Plot
- Canonical Score Plot
|
Statistics: Multivariate Analysis: Discriminant Analysis
|
|
|
Statistics: ROC Curve
|
Comparing One, Two or More Groups
Origin provides parametric and non-parametric tests to compare one, two, three or more groups.
Parametric Hypothesis Tests
Statistics, t-Testst-Tests
| Feature
|
Menu Entry
|
- One-Sample t-Test
- Two-Sample t-Test
- Pair-Sample t-Test
- One-Sample Test for Variance
- Two-Sample Test for Variance
|
Statistics: Hypothesis Testing
|
- One-Sample Proportion Test
- Two-Sample Proportion Test
|
Statistics: Hypothesis Testing
|
- Two-Sample t-Test on Rows
- Pair-Sample t-Test on Rows
|
Statistics: Hypothesis Testing
|
ANOVA
Statistics, ANOVAANOVA
| Feature
|
Menu Entry
|
- One-Way ANOVA
- Two-Way ANOVA
- Three-Way ANOVA
- One-Way Repeated-Measures ANOVA
- Two-Way Repeated-Measures ANOVA
- (Supports both Balanced and Unbalanced data)
|
Statistics: ANOVA
|
Non-parametric Tests
Statistics, Non-parametricNon-parametric Statistics
| Feature
|
Menu Entry
|
- One-Sample Wilcoxon Signed Rank Test
- Paired-Sample Wilcoxon Signed Rank Test
- Paired-Sample Sign Test
- Mann-Whitney Test
- Two-Sample Kolmogorov-Smirnov Test
- Kruskal-Wallis ANOVA
- Moods Median Test
- Friedman ANOVA
|
Statistics:Nonparametric Tests
|
| Notes:
Multiple nonparametric tests can be run simultaneously. (Accessible from the Statistics:Nonparametric Tests menu ) Available options are:
- (NPH) K Independent Samples: Kruskal-Wallis ANOVA and Mood's Median Test
- (NPH) Paired Samples: Paired-Sample Wilcoxon Signed Rank Test and Paired-Sample Sign Test
- (NPH) Two Independent Samples: Mann-Whitney Test and Two-Sample Kolmogorov-Smirnov Test
|
Advanced Statistics
Several additional tools are available in OriginPro.
Multivariate Analysis
Statistics, MultivariateMultivariate Statistics
Origin offers several multivariate analysis methods to help you simplify, classify, or make predictions from your data.
| Feature
|
Menu Entry
|
- Principal Component Analysis
- K-Means Cluster
- Hierarchical Cluster
- Discriminant Analysis
- Canonical Discriminant Analysis
- Partial Least Squares
|
Statistics:Multivariate Analysis
|
| Notes: Canonical Discriminant Analysis is integrated with Discriminant Analysis. It is accessible from the Statistics:Multivariate Analysis:Discriminant Analysis: Canonical Discriminant Analysis(System) menu.
|
Survival Analysis
Statistics, Survival AnalysisSurvival Analysis
OriginPro includes widely used survival tests to quantify survivorship in a population.
| Feature
|
Menu Entry
|
- Kaplan-Meier Product-limit Estimator
- Comparing Survival Curves
- Cox Proportional Hazards Model
- Weibull Fit Model
|
Statistics:Survival Analysis
|
| Notes: Comparing Survival Curves is accessible in the Kaplan-Meier Product-limit Estimator feature.
|
Power and Sample Size
Statistics, Power and Sample Size
Origin provides eight types of power and sample size analysis, useful in designing experiments. Origin can compute the power of the experiment for a given sample size and can also compute the required sample size for given power values.
| Feature
|
Menu Entry
|
- One-Proportion Test
- Two-Proportion Test
- One-Sample t-Test
- Two-Sample t-Test
- Paired-Sample t-Test
- One-Variance Test
- Two-Variance Test
- One-Way ANOVA
|
Statistics: Power and Sample Size
|
ROC Curve
Statistics, ROC CurveROC Curve
ROC Curve analysis is useful in determining if an incident has occurred, or in comparing the accuracy of two methods that are used to discriminate between diseased and healthy cases.
| Feature
|
Menu Entry
|
|
|
Statistics: ROC Curve
|
Topics for Further Reading
|