8.5.5 Manual Control of the Graph LegendLegend-ManualControl
Object Properties Control
A graph legend is a specialized text object that is assigned the name "Legend" to provide for programmatic control. To see the name of the legend object, right-click on the legend and choose Properties. In the dialog that opens, click on the Programming tab.
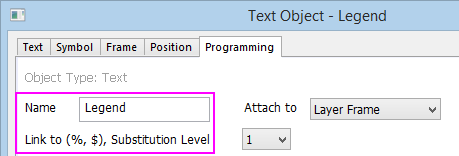
Note: the Link to (%,$), Substitution Level drop-down list is 1, which allows the legend object to be dynamically linked to the source data (i.e. should the source data change somehow -- you replace existing plots with new plots -- the legend will automatically update).
Rename the Legend Object
Because the legend object is a specialized text object with a name ("Legend") that has particular significance inside Origin, you must rename it in order to preserve the customizations that are discussed in this section. Otherwise, any action that refreshes the legend object may overwrite your customizations. Once you rename the legend object, it becomes a static text object and it is no longer programmatically controlled.
To rename the legend object:
- Click on the legend object to select it.
- From the menu, choose Format: Object Properties....
OR
Right-click and choose Properties... from the shortcut menu.
- Go to Programming tab
- Change Name to something other than "Legend," then click OK.
Resize the Legend Object
There are two ways to manually resize the legend object: You can increase the size of the object with or without increasing the size of the symbols and text.
- To resize the data plot symbols/text while increasing the size of the legend object (for legend on 2D or 3D graphs):
- Click on the legend object and 8 anchor points will show.
- Drag an anchor point to resize the legend object. The aspect ratio will be kept and the data plot symbols and texts will also be resized.
- To resize legend object without increasing the size of the symbols and text (2D or 3D graph legends):
- Move the cursor to the legend background border lines and when it changes to
 , click and the sizing handles (the " = " marks) will appear. , click and the sizing handles (the " = " marks) will appear.

- Drag a handle to resize the background.
Alternatively, you can use the text object properties object.margin.left/right/bottom/top to change the legend margin.
- To resize legend object only (3D graph legends):
- Click on the legend object in 3D graph and the object control button groups show:
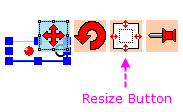
- Click the Resize button and the sizing handles (the " = " marks) will appear:

- Drag a handle to resize the background. This control will not resize the data plot symbols and texts.
Arrange Legend Entries into One Column/Row
To quickly arrange legend entries into one column/row, right click on the legend and select Legend:Arrange in Vertical/Horizontal.
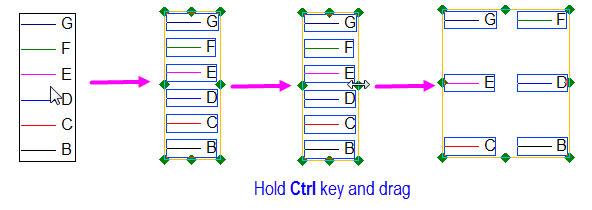
Arrange Legend Entries into Multiple Columns
To arrange legend entries into multiple columns for 2D graph, first select the legend object and then hold Ctrl key to drag one of the green handles to arrange entries properly. To adjust the gap between arranged entries, hold Ctrl key again to drag one of the green handles.
The Legend Object Properties Dialog Box
The legend object's Properties dialog is useful for modifications to graph legend content, formatting, position, etc. Right-click on the legend object and choose Properties:
- Text: Modification of LabTalk code used to generate legend symbols and text, plus many text formatting options. In addition, you can manually add legend symbols, insert plot-related variables or open the Symbol Map. See the Text tab controls.
- Symbol: Modification of symbol formatting. Modifications apply to all plot symbols and they are preserved during subsequent legend update and reconstruction operations. See the Symbol tab controls.
- Frame: Controls for legend frame formatting. See the Frame tab controls.
- Position: Control the size, anchor point and movement of the legend object. See the Position tab controls.
- Programming: Control Substitution Level (important for programmatic control), name of the legend object and scripts that are run after certain actions are performed on the graph page or data plots. See the Programming tab controls.
Manual Editing of the Legend Object
By default, Origin's graph templates are set up to use plot metadata when creating the graph legend. Such metadata are typically read into the worksheet on data import and stored in the column label row area of the worksheet. For instance, many 2D graphs will use text stored in the Comments row, or if that is empty, text in the Long Name or Short Name rows; others may use Long Name & Units. In any case, these things are customizable and can be saved as defaults with the graph template. In general, we recommend this method of legend customization.
However, you may have good reasons for wanting to manually edit the graph legend. For any kind of legend object, you can overwrite the default %( ) substitution notation and replace it with manually added symbols or text. You can do this by:
- Double-click on the legend object or right-click on it and choose Properties (plot symbols or text).
- Ctrl + double-click on the legend text to edit "in-place" (recommended only for adjustments to text).
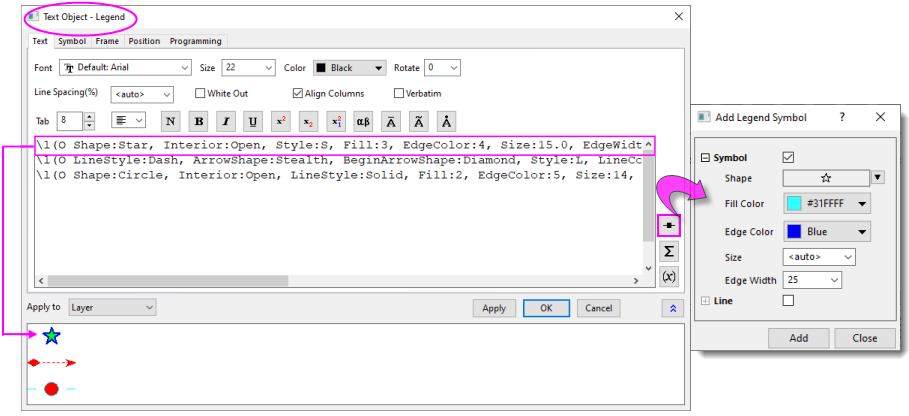
Inserting Legend Symbols and Text Using the Properties Dialog
You can manually insert symbols (incl. lines) and text using the Properties dialog box. This gives you access to all symbols in the Symbol Gallery, including any user-defined symbols that you may have added.
- Right-click on the legend object and choose Properties.
- On the Text tab, click the Add Legend Symbol
 button on the right side of the dialog. button on the right side of the dialog.
- Choose symbol options, then Insert.
- Append your label to the end of the inserted symbol code. You can manually enter your legend text or you can build it using LabTalk substitution notation, thereby allowing you to incorporate plot metadata into your legend. For more information see Legend Substitution Notation, particularly the section on Legend Text Customization.
Direct Edits of the Legend Text
For simple text edits, you can forgo the Properties dialog box and do direct "in-place" editing of the legend text:
- Ctrl + double-click on the legend text to enter in-place edit mode.
- Highlight the %( ) substitution notation and overwrite it with your arbitrary text.
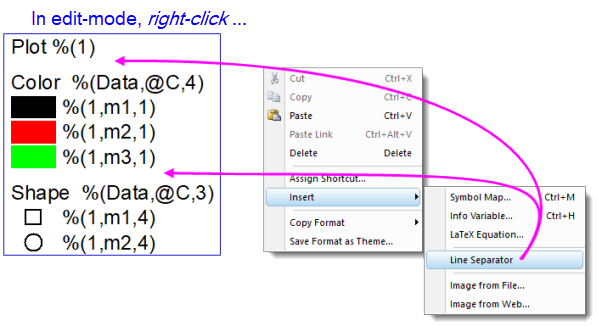
Inserting Line Separators in the Legend Object
The line spacing between entries in the legend (or in any multi-line text object) is controlled by the Line Spacing (%) setting on the Properties Text tab. Use this control to apply a uniform spacing between rows in the legend object.
To create irregular line spacing between two or more legend entries:
- Double-click on the legend object to start in-place editing and place your cursor at the end of the line (legend entry).
- Right-click and choose Insert: Line Separator from the shortcut menu.
- Alternately -- and for greater spacing control -- right-click on the legend object and choose Properties. In the edit box, place your cursor at the end of a line and click the Separator button
 . Note that this inserts a \sep:nn escape sequence into the edit box text, the numeric portion of the escape sequence being the height of the inserted space as percent of font height. Adjust the numeric portion, as needed. . Note that this inserts a \sep:nn escape sequence into the edit box text, the numeric portion of the escape sequence being the height of the inserted space as percent of font height. Adjust the numeric portion, as needed.
How the Legend Entry is Constructed
Origin supports four types of legend objects and two scale objects. This section provides advanced information concerning construction of the legend entry for the four legend objects. While it takes a bit more effort to understand how Origin's LabTalk scripting language is used for constructing graph legends, it is hoped that this information might ultimately prove more useful than simply manually creating legend entries that have no programmatic link to the data that they describe.
Constructing the Legend Symbol
The data plot symbol is the graphical indicator of the dataset and by default, it always follows the style of the data plot itself. Each of the four different types of legend objects has its own syntax for constructing data plot symbols in the Properties dialog.
Note: Square brackets enclose optional arguments.
| Legend Type
|
Default Syntax
|
Example
|
| Data Plot Legend
|
\L([LayerIndex.]PlotIndex)
|
- \L(2.1)
- Use the style of the 1st data plot in layer 2
- \L(3)
- Use the style of the 3rd data plot in the active layer
- \L(1, AB0)
- Use in the fill area graph that sets as follow: Plot Details > Line tab> Fill Area Under Curve > Fill to next data plot - Above Below Colors. Use the line style of the 1st data plot in in the active layer
- \L(1, AB1)
- Use in the fill area - two colors graph. Use the Above pattern style of the 1st data plot in in the active layer
- \L(1, AB2)
- Use in the fill area - two colors graph. Use the Below pattern style of the 1st data plot in in the active layer
|
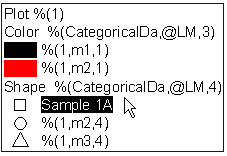
| Legend for Categorical Values
|
\L(PlotIndex, mCategoryIndex, CategoryType)
|
- \L(3, m2, 1)
- Use the style of the 2nd categorical entry(mCategoryIndex) of the 3rd data plot(PlotIndex) based on the categorization by edge color(CategoryType).
- For a complete list of indexing numbers for CategoryType, please refer to this help file page.
|
| Point by Point Legend
|
\L(PlotIndex,ElementIndex)
|
- \L(3,4)
- Use the style of the 4th data point in the 3rd plot of the active layer
|
| Legend for Box Chart Components
|
\L(PlotIndex,ComponentChar)
|
- \L(2,W)
- Use the style of the Whisker lines of the 2nd box chart.
- For a complete list of available characters for ComponentChar, please refer to this help file page.
|
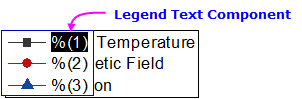
Constructing the Legend Text
In a legend object, the text immediately following the data plot symbol further describes the source of the data plot. By default, the %( ) substitution notation is used in the Object Properties dialog to define the text for each data plot symbol. Normally, the %( ) substitution notation calls a variable from the source data column of the corresponding data plot.
The default syntaxes used for different legend objects are summarized in the table below. Note: Square brackets enclose optional arguments.
| Legend Type
|
Default Syntax
|
Example
|
| Data Plot Legend
|
%([LayerIndex.]PlotIndex)
|
- %(1.2)
- Use the information from the source data column of the 2nd data plot in Layer 1. The information is defined by the translation mode of this graph window.
- %(1)
- Use the information from the source data column for the 1st data plot in the active layer
- %(1, @V"Above")
- Use in the fill area graph that sets as follow: Plot Details > Line tab> Fill Area Under Curve > Fill to next data plot - Above Below Colors. Shows as "Above 1st data plot"
- %(1, @V"Below")
- Use in the fill area - two colors graph. Shows as "Below 1st data plot"
|
| Legend for Categorical Values
|
%(PlotIndex, mCategoryIndex, CategoryValue)
|
- %(3, m2, 1)
- Use the indexing value of the 2nd categorical entry(mCategoryIndex) of the 3rd data plot(PlotIndex) based on the categorization by edge color(CategoryType).
|
| Point by Point Legend
|
%(PlotIndex,@L,ElementIndex)
|
- %(2,@L,3)
- Use the X value of the 3rd data point in the 2nd plot
|
| Legend for Box Chart Components
|
%(PlotIndex,@V"Box_ComponentChar")
|
- %(1,@V"Box_W")
- Use the Range name of the Whisker of the 1st box chart.
- For a complete list of available characters for ComponentChar, please refer to this help file.
|
| Legend for plots from different layer or group
|
%(PlotIndex,@GL)
%(PlotIndex,@GG)
|
- %(2,@GL)
- Use the Layer name of the second plot.
- %(2,@GG)
- Use the group name of the second plot.
If there are only default layer names such as Layer1 or default group layers such as g1, these notations will show the layer or group information as blank.
|
Advanced Topics
Advanced Legend Symbol Customization
You can add legend symbols that are independent of plotted data using the Add Legend Symbol button in the legend object Properties dialog box (mentioned previously). While the symbol can be constructed entirely within the Properties dialog's Add Legend Symbol dialog (Text tab), that syntax is here for those who might be interested: Options for Constructing Symbol, Line + Symbol, Line.
Custom Legend Symbols in Origin 2017 and earlier:
Prior to the addition of the Add Legend Symbol button in Origin 2018, you could only add plot-independent symbols to the graph using the syntax outlined in this section of the LabTalk Reference.
Advanced Legend Text Customization
The legend substitution is a special kind of the %( ) substitution notation which has the following syntax:
%([LayerIndex.]PlotIndex[PlotDesignChar] [,@option])
- The LayerIndex is an optional numeric value. If not specified, the active layer will be used.
- The PlotIndex is a numeric value that must be specified, this is used to refer the source data worksheet of the specified data plot. While PlotDesignChar and @option have default values, so these two variables are optional.
- The PlotDesignChar is used to refer a specified data column in the data plot, characters like X, Y, or Z can be assigned. By default, for most 2D plots the PlotDesignChar will be assigned as Y, while for most 3D plots it will be Z.
- The @option is an argument to specify what kind of worksheet information should be used as legend text. The default option is specified in the Legends/Titles tab in the Plot Details dialog of the graph.(Use Format: Page to open the dialog.) For a complete list of available @option and examples on how to use them, please refer to the Complete List of @Options.
 | You can use a combination of @options in the legend substitution notation. The syntax is %(PlotIndex,@(@option1+@option2+...)). An example would be: use %(1,@(@LA @LC)) to substitute the texts in combination of Long Name and Comments.
|
For More Information on Legend Customization
See the Legend Substitution Notation page in the LabTalk Language Reference.
|