8.5.1 Legend for Categorical ValuesLegend-CateData
Introduction
A categorical values legend can be added to any graph that meets the following requirements:
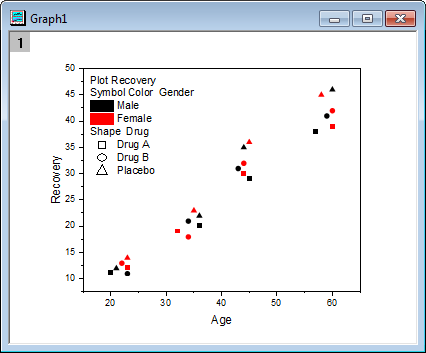
In this example, researchers studied Recovery Time (Y axis) versus Age of Patient (X axis) while looking at the interactions of two additional variables: gender (Male or Female) and treatment (Drug A, Drug B or Placebo). Gender and treatment data provide the indexing variables for symbol color and symbol shape, respectively. The plot and the accompanying categorical legend for this study would look something like this:
 . .
Create a Categorical Values Legend
- If a graph fits the requirements above, clicking the Reconstruct Legend
 toolbar button will update the graph with a categorical values legend. toolbar button will update the graph with a categorical values legend.
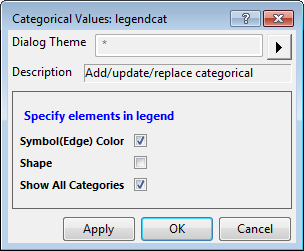
- To customize the categorical values legend further, right-click on the categorical legend and choose Legend: Categorical Values.... This opens the legendcat dialog.
- If the current legend isn't a categorical values legend, right-clicking on it and choosing Legend: Categorical Values... will append a categorical values legend to the existing legend.
- Reconstruct Legend and Categorical Values... are also accessible from the Graph menu, and when right-clicking in the graph.
-
Note: The legendcat dialog box uses the legendcat X-Function.
| Plot Attribute
|
If one plot attribute has included color-indexing or size/shape/interior/fill pattern indexing, a check box of this plot attribute will be shown and such check box can be used to determine whether to add this plot attribute as a categorical entry.
| Note: Since Origin 2019, for a plot with symbols, size of which has been indexed to a numeric column, the symbol size attribute will not be checked by default in the legendcat dialog box, which means the categorical legend will not include the symbol size entries.
|
Up to 13 plot attributes could be shown here, they are: Symbol(Edge) Color, Fill Color, Pattern Color, Fill Pattern, Shape, Interior, Size, Line Color, Line Style, Line Width,Vector Color(vector plot), Vector Line Style(vector plot) and Distribution Fill(box chart).
|
| Show All Categories
|
This is only useful when user defined categories are added to the indexing column in the (Column Properties) Categories tab. When this is checked, the manually added categories will also show in the legend. Otherwise, only the categories that exist in indexing column will show in the legend.
|
Note: There is legend title for each category to indicate what plot attribute is mapped to which data. However, in the following two cases, title is not needed and thus is automatically hidden:
- only one column is used for all plot attributes mapping
- only one plot attribute is mapped to categorical data
|
Sorting Categories in the Legend
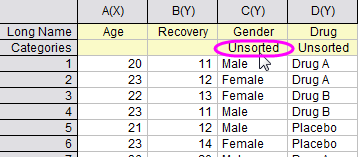
The order of entries in a categorical values legend follows the order of first appearance in the categorical values data column. By default, when a column is set as Categorical, the values are unsorted (you will see Unsorted in the column's Categories label row). If you would like to put the values in alphabetical order (ascending or descending):
- Either double-click the Categories label cell, or double-click on the worksheet column heading to open the Column Properties dialog box and click the Categories tab.
-
- Set Sort to Ascending or Descending.
-
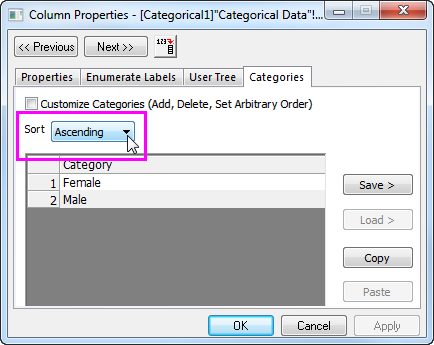
- Click OK and your categorical values legend will automatically update with the new sort order.
Other Customizations to Categorical Values Legends
- Customizations to data plot symbols and legend text, can be made through the legend's Text tab in the Object Properties dialog box.
- By default, the legend for categorical data uses the following syntax to construct the legend symbol and legend text:
- \L(PlotIndex, mCategoryIndex, CategoryType) %(PlotIndex, mCategoryIndex, CategoryValue)
- For more information on use of this notation, refer to this LabTalk help file page.
|